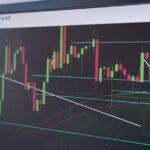
How to Analyze Forex Charts: 5 Key Steps for Traders

Table of Contents
- Introduction
- What Is Forex Chart Analysis?
- Why Chart Analysis Matters for Traders and Investors
- Core Concepts
- Step-by-Step Guide to Analyzing Forex Charts
- Practical Tips for Better Results
- Common Mistakes to Avoid
- Frequently Asked Questions
- Conclusion
Introduction
Imagine the EUR/USD pair is approaching a decade-long psychological level at 1.1000. While a novice trader might see a flat line and guess the direction, a professional analyst sees a confluence of liquidity, institutional order blocks, and a shift in market structure. The difference between a random guess and a high-probability trade is the ability to systematically interpret the data on the screen.
Most retail traders struggle because they treat charts like a painting rather than a map of human psychology and institutional flow. They jump into 15-minute timeframes without understanding the daily trend, leading to noise trades that result in rapid drawdowns. This lack of a structured process is why many traders fail despite knowing what a trendline is.
To succeed, you must learn how to perform forex chart analysis through a top-down lens. This process removes emotion and replaces it with a repeatable framework. This guide provides a five-step system to move from raw price data to a precise entry and exit plan, ensuring that every trade is backed by a logical thesis rather than a gut feeling.
What Is Forex Chart Analysis?
Forex chart analysis is the process of reviewing historical price movements of a currency pair to identify patterns and trends that suggest future price direction. It is primarily divided into technical analysis, which focuses on price and volume, and fundamental analysis, which focuses on economic drivers like interest rate decisions from the Federal Reserve or the European Central Bank.
For example, if you are analyzing the GBP/JPY pair, you aren’t just looking at a line moving up or down. You are observing how the price reacts to specific levels, whether the momentum is accelerating or decelerating, and whether the current price action aligns with the broader economic sentiment regarding the Bank of Japan’s monetary policy. Technical analysis allows a trader to quantify these observations, turning a vague feeling about a currency into a measurable trade setup with a defined risk profile.
Why Chart Analysis Matters for Traders and Investors
Without a systematic way to analyze charts, you are essentially gambling on direction. Professional traders use chart analysis to define their risk-to-reward ratio. By identifying where a trend is likely to reverse or continue, you can place a stop-loss at a logical point of invalidation rather than a random number of pips. This ensures that a single losing trade does not wipe out weeks of gains.
Ignoring chart analysis often leads to fighting the trend, where a trader sells into a strong bullish rally because they believe the price has gone up too much. This is a primary cause of account blowouts. When you analyze the chart correctly, you identify the path of least resistance, which is the direction the market is most likely to move based on current order flow.
Also, chart analysis allows you to time your entries. While fundamentals tell you what to buy or sell, technical analysis tells you when to execute. Entering a trade at a precise support zone rather than in the middle of a range can be the difference between a 1:1 risk-reward trade and a 1:5 trade. By waiting for the price to reach a high-value area, you reduce your risk and increase your potential profit per trade.
Market Structure and Trend Identification
Market structure is the foundation of all technical analysis. It consists of a series of higher highs and higher lows in an uptrend, or lower highs and lower lows in a downtrend. When these patterns break, it signals a potential change in regime. Understanding structure allows a trader to distinguish between a temporary pullback and a full trend reversal.
Consider a scenario where the USD/CAD is in a clear uptrend on the daily chart. You see the price climbing, pulling back slightly, and then pushing to a new peak. If the price suddenly drops and closes below the previous higher low, the market structure has shifted. This break of structure suggests that the bullish momentum has exhausted and a bearish phase may begin. Professional traders wait for this shift to be confirmed on the chart before switching their bias, avoiding the trap of trying to pick a top in a strong market.
Support and Resistance Zones
Support and resistance are not thin lines, but rather zones where buying and selling interest is concentrated. Support is a price floor where demand outweighs supply; resistance is a ceiling where supply outweighs demand. These zones often represent areas where institutional players have previously placed large orders.
In a real-market scenario, look at the EUR/USD. If the price has touched 1.0500 three times in the last six months and bounced upward each time, that level is a significant support zone. But if the price breaks below 1.0500 and then returns to test it from below, that former support now becomes resistance. This is known as a role reversal and is a high-probability area for a short position. Identifying these zones helps a trader avoid buying at the top of a range or selling at the bottom.
Candlestick Pattern Recognition
Candlesticks provide a snapshot of the battle between bulls and bears within a specific timeframe. The wick of a candle shows the price extremes, while the body shows the closing and opening prices. By reading these patterns, a trader can gauge the immediate conviction of the market.
A concrete example is the Morning Star pattern. Imagine the EUR/USD has been in a downtrend and hits a weekly support level. You see a large bearish candle, followed by a small indecision candle (doji), and then a large bullish candle that closes well into the body of the first candle. This sequence indicates that the bears have lost control and the bulls have stepped in, signaling a potential bullish reversal. Such patterns are most effective when they appear at pre-identified support or resistance zones.
Multi-Timeframe Confluence
Confluence occurs when multiple independent signals align at the same price point. The most powerful confluence comes from multi-timeframe analysis, where the trend on a higher timeframe (HTF) aligns with a setup on a lower timeframe (LTF). This layering of evidence increases the probability of a successful trade.
For example, you identify a bullish trend on the Weekly chart for GBP/USD. You then drop down to the Daily chart and find that the price is retracing into a support zone. Finally, you move to the 4-hour chart to look for a bullish engulfing candle. When the Weekly trend, Daily support, and 4-hour candle all point upward, you have confluence. Trading against the HTF trend is one of the fastest ways to incur a significant drawdown, as you are essentially fighting the institutional money.
Momentum Oscillators and Volume
While price is king, oscillators like the Relative Strength Index (RSI) or Stochastic Oscillator help identify overextended conditions or divergences. Divergence occurs when the price makes a new high, but the oscillator makes a lower high, suggesting the trend is losing steam.
Imagine the USD/JPY is rallying strongly toward a resistance zone. The price hits a new peak, but the RSI is trending downward. This bearish divergence suggests that while the price is higher, the momentum is fading. This does not mean you sell immediately, but it warns you that the current rally is fragile and a reversal is likely. Volume analysis can further confirm these moves, as a breakout on low volume is often a fake-out, whereas a breakout on high volume suggests strong institutional participation.
Step 1 — Establish the Macro Trend
Start with the highest relevant timeframe—usually the Weekly or Daily chart. Your goal here is not to find an entry, but to determine the bias. Ask yourself: Is the market trending up, down, or ranging? This step filters out the noise and prevents you from taking trades that contradict the primary market direction.
If the Daily chart shows a series of lower highs and lower lows, your bias is bearish. You will now only look for sell opportunities. By aligning yourself with the macro trend, you avoid the mistake of trying to pick a bottom in a crashing market. A trader who ignores the macro trend often finds themselves in a position that looks good on a 5-minute chart but is fundamentally doomed on the Daily chart.
Step 2 — Map Key Supply and Demand Zones
Once the bias is set, identify the major areas where the price has historically reacted. Use the Daily and 4-hour charts to draw horizontal zones of support and resistance. These are the areas where the market is likely to experience volatility or a reversal.
Look for clean levels—areas where the price touched and reversed sharply. Avoid cluttering your chart with too many lines, as this leads to analysis paralysis. Focus on the levels that are obvious to all market participants, as these are the zones where institutional liquidity usually resides. When price enters these zones, the probability of a reaction increases significantly.
Step 3 — Identify the Current Market Phase
Determine if the price is currently in an impulse move (trending) or a corrective move (retracing). This prevents you from entering a trade too early. A common mistake is entering a trend trade while the market is still in a corrective phase, which leads to unnecessary drawdowns.
If the trend is bullish but the price is currently dropping back toward your support zone, you are in a corrective phase. You wait for the price to enter the zone and then look for a sign of strength. Entering during the corrective phase without a confirmation signal is essentially catching a falling knife. Patience in this phase is what separates professional traders from gamblers.
Step 4 — Look for Execution Triggers
Now move to a lower timeframe, such as the 1-hour or 15-minute chart, to find a specific trigger. This is where candlestick patterns or chart patterns come into play. The trigger is the final piece of evidence that confirms the price is ready to move in your predicted direction.
For example, if you are trading a trend-continuation strategy on GBP/JPY, you might spot a bullish flag pattern on the 4-hour chart. A flag consists of a sharp move up (the pole) followed by a narrow, downward-sloping consolidation (the flag). The trigger is a decisive break above the upper boundary of the flag, confirming that the buyers have regained control. This precise entry allows for a tighter stop-loss and a better risk-to-reward ratio.
Step 5 — Define Risk and Exit Parameters
Before clicking buy or sell, calculate your position size based on the distance to your stop-loss. Your stop-loss should be placed where the chart analysis is proven wrong—such as below the recent swing low or outside the support zone. This ensures that you exit the trade if the market structure changes.
Set a target based on the next major resistance zone. If your stop-loss is 30 pips and your target is 90 pips, you have a 1:3 risk-to-reward ratio. If the ratio is less than 1:2, the trade may not be worth the risk, even if the chart looks perfect. Disciplined risk management is the only way to survive the volatility of the forex market over the long term.
Practical Tips for Better Results
- Use a clean chart approach. Avoid adding five different indicators; they often lag and create contradictory signals. Stick to price action and one or two oscillators to keep your vision clear.
- Focus on the Session Overlap. The London and New York overlap (roughly 8:00 AM to 12:00 PM EST) typically offers the highest liquidity and the cleanest trends. This is when the largest volume of institutional orders is processed.
- Trade the Major pairs first. Pairs like EUR/USD and GBP/USD have tighter spreads and more predictable movements than exotic pairs, which can be prone to erratic spikes and low liquidity.
- Keep a trading journal with screenshots. Capture the chart at the time of entry and again at the time of exit. This allows you to review whether your analysis was correct or if you were simply lucky, facilitating a process of continuous improvement.
- Respect the News Calendar. Technical analysis often fails during high-impact events like Non-Farm Payrolls (NFP) or CPI prints. Avoid entering new positions minutes before a major central bank announcement to avoid slippage.
- Use Limit Orders at zones rather than Market Orders in the middle of a move. This ensures you get a better price and maintain a healthier risk-to-reward ratio by avoiding the urge to chase the price.
Common Mistakes to Avoid
- Over-analyzing lower timeframes. Spending hours on a 1-minute chart often leads to analysis paralysis and causes you to miss the bigger picture on the Daily chart. The lower the timeframe, the more noise you encounter.
- Forcing a trade. Trying to find a pattern that isn’t there just because you feel the market should reverse is a recipe for losses. The market does not owe you a trade; wait for the setup to come to you.
- Ignoring the Stop-Loss. Moving a stop-loss further away to avoid a loss is a psychological trap that leads to catastrophic account drawdowns. A stop-loss is a non-negotiable boundary.
- Using too much leverage. In forex, high leverage can amplify small price movements. A few pips of slippage during a high-volatility event can wipe out a significant portion of your margin if your position size is too large.
- Confusing a pullback with a reversal. Many traders see a small dip in an uptrend and immediately switch to a bearish bias, ignoring the overarching bullish structure. Always verify a break of structure before changing your bias.
How do I start analyzing forex charts for beginners?
Start by opening a demo account and focusing on one currency pair, such as EUR/USD. Learn to identify the trend on the Daily chart and practice drawing support and resistance zones. Do not add indicators until you can identify a trend and a support zone using only a naked price chart. Once you are comfortable with price action, you can introduce a single oscillator like the RSI to help identify momentum.
What is the difference between fundamental and technical analysis?
Fundamental analysis looks at the why behind price movements, such as GDP growth, inflation, and central bank interest rates. It focuses on the underlying value of a currency. Technical analysis looks at the what and when, using price patterns and historical data to predict future moves. Most professional traders use a hybrid approach, using fundamentals to determine the direction and technicals to time the entry.
Why are candlestick patterns important in forex?
Candlesticks reveal the immediate sentiment of market participants. While a line chart only shows the closing price, a candlestick shows the open, high, low, and close, revealing whether the market rejected a certain price level or pushed through it with strength. This allows a trader to see the psychological battle between buyers and sellers in real-time.
When is the best time to analyze currency pairs?
The most reliable analysis usually happens during the overlap of the London and New York sessions. This is when the highest volume of trades occurs, meaning the patterns and breakouts are more likely to be driven by institutional flow rather than random retail noise. Analyzing during low-volume periods, such as the late Asian session, often leads to false signals.
Can I trade using only one timeframe?
While possible, it is risky. Trading only a low timeframe (like 5-minute) leaves you blind to the macro trend, while trading only a high timeframe (like Weekly) makes your entries imprecise. Multi-timeframe analysis provides a necessary filter for quality trades, ensuring that your short-term entry is aligned with the long-term trend.
Is automated chart analysis better than manual analysis?
Automated tools can scan hundreds of pairs for patterns faster than a human, but they lack the ability to interpret context. An algorithm might see a head and shoulders pattern, but it cannot account for a sudden geopolitical event or a change in central bank rhetoric. Manual analysis allows for the integration of nuance and discretion that algorithms currently cannot replicate.
Conclusion
The ability to analyze forex charts is not about predicting the future with certainty; it is about managing probabilities. The most critical lesson is that no single indicator or pattern is a magic bullet. Success comes from the confluence of market structure, key zones, and disciplined risk management. The goal is to find a high-probability edge and execute it consistently over hundreds of trades.
Your next step should be to open a chart of a major pair and identify the trend on the Daily timeframe. Once you have established a bias, look for the nearest support or resistance zone and wait for a candlestick confirmation. This disciplined approach removes the guesswork and puts you in control of your trading.
Remember that forex trading involves significant risk. High leverage can lead to losses that exceed your initial deposit. Never trade money you cannot afford to lose, and always prioritize capital preservation over aggressive gains.
*
Risk Disclaimer: Trading foreign exchange on margin carries a high level of risk and may not be suitable for all investors. The high degree of leverage can work against you as well as for you. Before deciding to invest in foreign exchange, you should carefully consider your investment objectives, level of experience, and risk appetite.
—
This article is for educational purposes only and does not constitute investment advice. Trading and investing carry risk of loss; never invest more than you can afford to lose.
Last reviewed: August 2026