


















































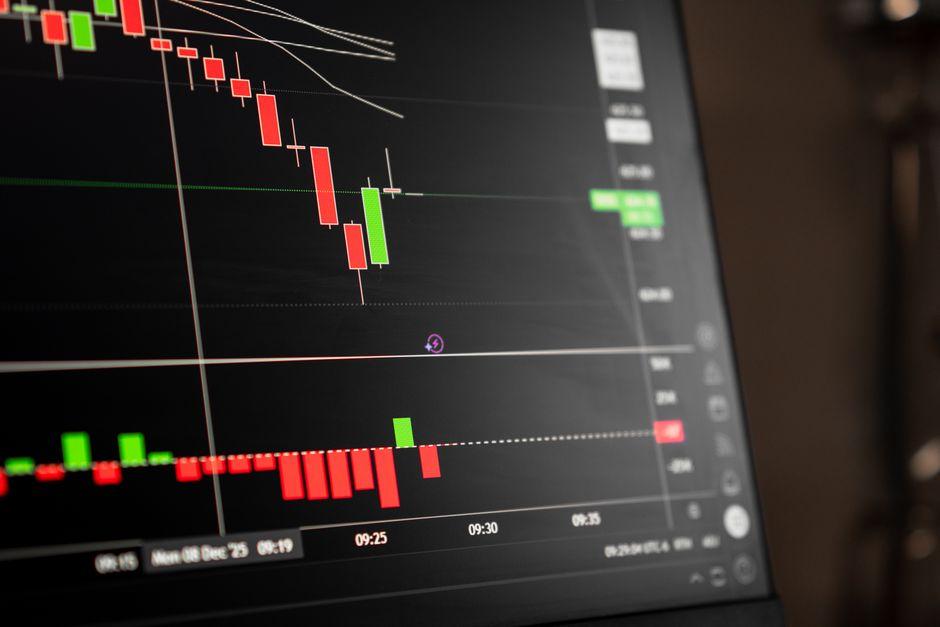
What is Price Action in Trading? Key Concepts Explained

Table of Contents
- Introduction
- What Is Price Action?
- Why Price Action Matters for Traders and Investors
- Core Concepts
- Step-by-Step Guide
- Practical Tips for Better Results
- Common Mistakes to Avoid
- Frequently Asked Questions
- Conclusion
Introduction
Imagine a trader staring at a chart of the S&P 500, cluttered with three different moving averages, a Relative Strength Index (RSI) screaming oversold, and a MACD crossover. Despite these signals, the price continues to slide. The trader is fighting the tape because they are relying on lagging indicators—mathematical derivatives of past price—rather than the price itself.
The fundamental problem for most retail traders is the reliance on black box indicators that tell you what happened, not what is happening. In a high-volatility regime, such as during a Federal Reserve interest rate announcement or a surprise CPI print, indicators often lag behind the actual move. This delay leads to late entries, missed opportunities, and oversized drawdowns that can devastate an account.
Understanding price action allows a trader to strip away the noise and focus on the only thing that actually moves a portfolio: the price. When you stop treating the chart as a puzzle to be solved with formulas and start treating it as a real-time record of buyer and seller psychology, your edge improves. This guide provides a professional framework for interpreting raw market data to identify high-probability setups based on order flow and market sentiment.
What Is Price Action?
Price action is the practice of analyzing the movement of an asset’s price over time to make trading decisions without the use of lagging indicators. It is based on the premise that all fundamental data, news, and sentiment are already baked into the current price. Instead of asking what a formula says about the trend, a price action trader asks where the liquidity is and who is currently in control of the market.
For example, if a trader observes the EUR/USD pair hitting a historical support zone and forming a series of bullish rejection candles, they are practicing price action. They are not waiting for a Stochastic oscillator to cross or a moving average to slope upward; they are observing the immediate interaction between buyers and sellers at a specific price level.
In essence, price action is the study of the footprints left by institutional players. While a retail trader might see a random spike in price, a price action specialist sees a liquidity grab or a stop-run designed to fuel a move in the opposite direction. It is the art of reading the tape in a digital age.
Why Price Action Matters for Traders and Investors
Price action is the primary language of the market. Institutional players—the hedge funds, sovereign wealth funds, and central banks that move the Nasdaq or the Treasury market—do not trade based on a 14-period RSI. They trade based on liquidity, volume, and order flow. When you learn to read price action, you are essentially learning to track the footprints of the smart money.
If you ignore price action and rely solely on indicators, you risk entering trades during fakeouts. A lagging indicator might signal a buy long after the move has peaked. By the time the signal appears, the professional traders are already exiting their positions and taking profits, leaving the retail trader to hold the bag during the subsequent correction.
For the swing trader, price action helps identify the exact moment a trend reverses, allowing for a more precise entry that reduces the required risk. For the scalper, it reveals the micro-structures and imbalances that lead to quick profit targets. Regardless of the timeframe, price action provides a real-time map of market sentiment, allowing for tighter stop-losses and a more favorable risk-reward ratio.
Candlestick Pattern Recognition
Candlesticks provide a visual representation of the battle between bulls and bears within a specific timeframe. Rather than attempting to memorize every obscure pattern, professional traders focus on those that signal a shift in momentum or a failure of a trend.
Consider the Pin Bar. This is a candle with a small body and a long wick, indicating that the price moved aggressively in one direction but was violently rejected. For example, if the Daily chart of an equity shows a long lower wick touching a historical support level, it suggests that buyers stepped in heavily, absorbing the sell orders. This is a high-probability signal that the downside move is exhausted and a reversal is likely.
Another critical pattern is the Engulfing candle. A bullish engulfing pattern occurs when a green candle completely overlaps the previous red candle. This indicates a sudden and decisive shift in power. If this happens after a prolonged downtrend, it often marks the start of a reversal as sellers are trapped and forced to cover their positions, creating a surge of buying pressure.
Support and Resistance Zones
Support and resistance are not thin lines; they are zones where a concentration of buy or sell orders exists. Price tends to react at these levels because they represent fair value or extreme value in the eyes of market participants.
Support is the price level where buying interest is strong enough to overcome selling pressure. Resistance is where selling pressure overcomes buying interest. In practice, a trader might identify a zone on the 4-hour chart of Bitcoin where the price has bounced three times over the last month. This area is now a psychological anchor for the market.
When price returns to this zone, the trader does not just buy blindly. They look for a price action confirmation—like a bullish engulfing candle or a pin bar—within that zone. This ensures they are trading with the current momentum rather than trying to catch a falling knife. By waiting for the reaction, the trader confirms that the zone is still active and respected by the market.
Market Structure (Higher Highs and Lower Lows)
Market structure is the foundation of trend identification. It removes the guesswork of whether a market is trending or ranging. A bullish trend is defined by a sequence of Higher Highs (HH) and Higher Lows (HL). A bearish trend is defined by Lower Highs (LH) and Lower Lows (LL).
Let’s look at a scenario in the Forex market. If the GBP/USD is making a series of higher highs, the trend is objectively up. But the moment the price fails to make a new higher high and instead breaks below the previous higher low, the market structure has shifted. This Change of Character (ChoCH) is a primary signal that the bullish trend is over and a bearish regime may be starting.
Trading against the market structure is the fastest way to blow an account. A disciplined trader only looks for long setups in a bullish structure and short setups in a bearish structure. Trying to pick a top in a strong uptrend is a low-probability gamble; following the structure is a professional strategy.
Chart Patterns
Chart patterns are geometric representations of market psychology. They help traders visualize the accumulation or distribution of assets.
The Head and Shoulders pattern is a classic reversal signal. It consists of a peak (shoulder), a higher peak (head), and another lower peak (shoulder). This structure shows that the buyers tried to push the price higher but failed to sustain the momentum. When the neckline breaks, it confirms that the trend has shifted from bullish to bearish, as the last line of support has collapsed.
Flags and Pennants, by contrast, are continuation patterns. They represent a brief pause or breather in a strong trend. For example, after a sharp move up in a tech stock, the price may consolidate sideways in a tight range, forming a flag. A breakout from this flag in the direction of the original trend usually leads to another impulsive move, as traders who missed the first leg enter the market in a fear of missing out (FOMO).
Volume Confirmation and Liquidity Gaps
Price movement without volume is often a trap. Volume confirms the validity of a price move. If price breaks through a resistance level on low volume, it is likely a bull trap and will quickly reverse. If the break occurs with a massive surge in volume, it suggests institutional participation and a higher probability that the move will be sustained.
Liquidity gaps, often referred to as Fair Value Gaps (FVG), occur when price moves so rapidly in one direction that it leaves behind an imbalance. This happens frequently during high-impact news events, such as a Non-Farm Payroll (NFP) release or a surprise Federal Reserve rate hike.
In a rapid bullish surge, the price may jump, leaving a gap where only buy orders were filled and no sell orders were matched. Historically, the market has a tendency to return to these gaps to fill the liquidity before continuing the trend. A trader can use these gaps as precise entry points, anticipating that the price will gravitate back toward the imbalance to find equilibrium before resuming its ascent.
Step-by-Step Guide
Step 1 — Identify the Market Regime
Before looking for a trade, determine the current environment. Is the market trending or ranging? Use a higher timeframe, such as the Daily or Weekly chart, to see the overall direction. This prevents you from fighting the primary trend.
If the price is making Higher Highs and Higher Lows, you are in a bullish regime. If the price is bouncing between two horizontal levels without a clear direction, you are in a range. This decision dictates your strategy: you buy the dips in a trend and sell the tops in a range. Attempting to use a trend-following strategy in a ranging market is a common cause of death by a thousand cuts.
Step 2 — Map Key Zones and Liquidity
Mark your support and resistance zones. Look for areas where the price has reacted strongly in the past. Identify where stop losses are likely sitting—usually just above previous highs or below previous lows. These areas are hotspots for liquidity.
For example, if you are trading the S&P 500, mark the previous day’s high and low. These are critical liquidity points. If the price sweeps the previous day’s low and then quickly recovers, it is often a liquidity grab. This suggests that the market has cleared out the weak long positions to find the fuel necessary for a move higher.
Step 3 — Wait for the Trigger (The Confirmation)
Do not enter a trade just because the price reached a zone. This is a common mistake that leads to catching falling knives. Wait for a price action trigger. This is the confirmation that the market is actually reacting the way you expect.
If you are looking for a long position at a support zone, wait for a Pin Bar or a Bullish Engulfing candle to close. The close of the candle is the signal. If the candle is still forming, you are guessing. Once the candle closes and confirms the rejection of the support zone, the trade is valid. The trigger is the bridge between a theoretical idea and a real trade.
Step 4 — Define Risk and Execute
Before clicking buy or sell, calculate your position size based on your account equity. Your stop-loss should be placed where the price action thesis is invalidated.
If you bought based on a Pin Bar, your stop-loss goes slightly below the wick of that Pin Bar. If the price hits that level, the support has failed, and your reason for the trade is gone. Ensure your target is at least twice the distance of your risk, maintaining a 1:2 risk-reward ratio. This ensures that even with a 40% win rate, you remain profitable over a large sample of trades.
Practical Tips for Better Results
- Use a top-down approach. Analyze the Weekly chart for the broad direction, the Daily for key zones, and the 1-hour or 15-minute for precise entries. This aligns your trade with the dominant market flow.
- Focus on confluence. A trade is higher probability if a support zone, a bullish candlestick, and a Fibonacci retracement level all align at the same price. The more reasons you have to take a trade, the higher the probability of success.
- Stop using more than two indicators. If you must use them, use them as filters to confirm a price action signal, not as the primary reason for the trade.
- Keep a trade journal. Record the price action setup, the emotion you felt, and the outcome. This is the only way to identify if you are over-trading or revenge trading.
- Trade the reaction, not the prediction. Don’t guess where the top is; wait for the price to show you that the top has formed through a structural shift.
- Respect the news calendar. Avoid entering new price action setups minutes before a major central bank announcement, as volatility can blow through any support or resistance, rendering your technical analysis temporarily irrelevant.
Common Mistakes to Avoid
- Trading in the middle of a range. This is where most chop happens, and stop-losses are frequently hit. The highest probability trades always occur at the edges of the range.
- Ignoring the trend. Trying to pick a bottom in a strong bearish trend is a recipe for a massive drawdown. The trend is your friend until the market structure explicitly tells you otherwise.
- Over-analyzing the 1-minute chart. Too much noise on low timeframes can lead to analysis paralysis and poor decision-making. The 1-minute chart often shows patterns that are completely irrelevant to the Daily trend.
- Moving stop-losses to avoid a loss. This is a psychological trap. If the price action invalidates your setup, exit the trade. Moving a stop-loss is an admission that you are gambling on a hope rather than trading a plan.
- Entering a trade without a confirmation candle. Buying just because the price looks cheap is gambling, not trading. Price can remain cheap for a long time before it finally turns.
How do I start learning price action trading?
Start by stripping your charts of all indicators and focusing exclusively on candlesticks. Practice identifying support and resistance zones on a demo account to build your eye for the market. Study market structure by marking higher highs and lower lows on historical charts to see how trends develop, mature, and eventually reverse.
What is the difference between price action and technical analysis?
Technical analysis is a broad umbrella that includes everything from Fibonacci levels and Elliot Wave theory to complex mathematical indicators like the Ichimau Kinko Hyo. Price action is a specific subset of technical analysis that focuses exclusively on the raw movement of price and volume, ignoring lagging formulas in favor of real-time data.
Why is price action considered more accurate than indicators?
Indicators are lagging; they calculate a value based on data that has already occurred. They are essentially a rearview mirror. Price action is leading; it shows the current interaction between buyers and sellers in real-time. By the time an indicator signals a trend change, the price action has often already moved significantly, leaving you to enter at a disadvantage.
When is the best time to use price action strategies?
Price action works in all market conditions, but it is most effective during high-liquidity sessions, such as the London or New York open. These times provide the volume necessary to create clear trends and reliable candlestick patterns. Low-volume periods, like the Asian session for certain pairs, can produce erratic movements that lack institutional conviction.
Can price action trading work on all timeframes?
Yes, the principles of supply and demand are fractal. A head-and-shoulders pattern on a 5-minute chart looks the same as one on a monthly chart. However, higher timeframes generally provide more reliable signals and significantly less noise. A daily pin bar is far more meaningful than a 1-minute pin bar.
Is price action trading suitable for beginners?
It is highly suitable because it teaches the fundamental mechanics of how markets work. While it requires more discipline and screen time than simply following a crossover signal, it provides a deeper understanding of risk and reward. It empowers the trader to understand why a move is happening rather than just knowing that it is happening.
Conclusion
The most important lesson in price action is that the chart is a map of human emotion—fear, greed, and hesitation. When you stop looking for the perfect indicator and start reading the raw movement of price, you stop guessing and start reacting. The goal is not to predict the future with certainty, but to identify a high-probability setup and manage the risk associated with it.
Your next step is to open a chart of a major index or currency pair and identify the last three major structural shifts where a higher high was followed by a lower low. Once you can see the structure, you can see the opportunity.
Trading involves significant risk of loss. No strategy, including price action, guarantees a profit. Always use a stop-loss and never risk more than a small percentage of your capital on a single trade.
*
Disclaimer: Trading financial instruments carries a high level of risk and may not be suitable for all investors. Past performance is not indicative of future results. The content provided here is for educational purposes only and does not constitute financial advice.
—
This article is for educational purposes only and does not constitute investment advice. Trading and investing carry risk of loss; never invest more than you can afford to lose.
Last reviewed: August 2026


