Price Action in Forex: How to Read Raw Price Movement

Table of Contents
- Introduction
- What Is Price Action in Forex?
- Why Price Action Matters for Traders and Investors
- Core Concepts
- Step-by-Step Guide to Reading Price Action
- Practical Tips for Better Results
- Common Mistakes to Avoid
- Frequently Asked Questions
- Conclusion
Introduction
Imagine a EUR/USD chart where every lagging indicator—the 50-day moving average, the Relative Strength Index (RSI), and the MACD—is screaming that the pair is oversold. A retail trader, seeing these signals, enters a long position. Meanwhile, the price continues to plummet, slicing through critical support levels with aggressive momentum. The indicator is merely calculating a mathematical average of the past, but the price is reacting to a real-time shift in Federal Reserve sentiment or a sudden liquidity drain during the New York session.
The fundamental problem for most traders is a heavy reliance on derivatives of price. Indicators do not move the market; order flow does. When you rely solely on a crossover or a stochastic reading, you are viewing a filtered, delayed version of reality. You are essentially reading a map of where the market was, rather than where it is going.
Understanding price action in forex allows you to strip away the noise and focus on the only variable that actually matters: the price. By interpreting the raw movement of candles, you can identify where institutional players—the big banks and hedge funds—are entering and exiting positions. This guide provides a professional framework for reading raw price movement to identify high-probability setups and manage risk with institutional precision.
What Is Price Action in Forex?
Price action is the practice of analyzing the raw movement of an asset’s price to determine future direction, without the use of lagging technical indicators. It is based on the premise that all relevant information—fundamental news, psychological sentiment, and institutional order flow—is already reflected in the price. In the eyes of a price action trader, the chart is the primary source of truth.
For example, if the GBP/JPY pair reaches a historical resistance zone and forms a series of candles with long upper wicks, this is a clear signal of rejection. A price action trader does not wait for an RSI divergence to confirm the move. They recognize the immediate rejection of higher prices as a sign that sellers have overwhelmed buyers at that specific level, suggesting a potential reversal or a period of consolidation. This approach prioritizes real-time data over mathematical formulas.
Why Price Action Matters for Traders and Investors
Most retail traders enter the market using indicators that are essentially mathematical formulas based on past price data. This creates an inherent lag. By the time a moving average crosses or an oscillator reaches an extreme, the most profitable part of the move has often already occurred. Price action eliminates this delay by focusing on the current tick.
Institutional traders—those at major investment banks or global macro hedge funds—do not trade based on a 14-period RSI. They trade based on liquidity, volume, and specific price levels where large blocks of orders are resting. By learning to read price action, you align your analysis with the entities that actually move the market. If you ignore price action, you risk trading against the prevailing trend or entering a position exactly where institutional smart money is looking to exit their positions.
Furthermore, price action provides a clearer understanding of risk management. When a trade is based on a specific price level, such as a support zone, the point of invalidation is obvious. If the price closes decisively below that zone, the bullish thesis is dead. This allows for tighter stop-loss placement and a more precise calculation of the reward-to-risk ratio, which is the cornerstone of long-term profitability in the FX markets.
Candlestick Psychology and Rejection Wicks
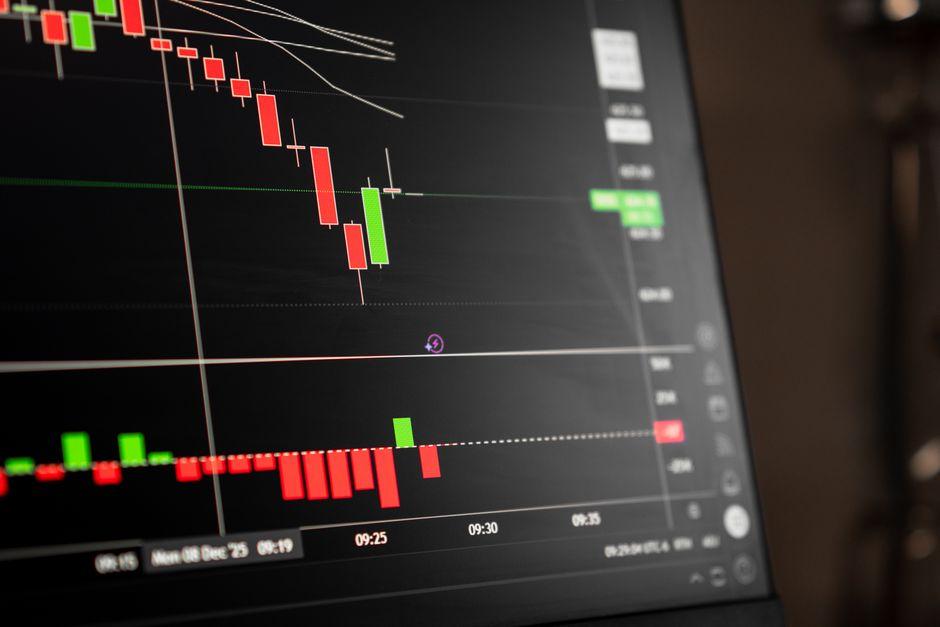
Every candle on a chart tells a story of the battle between buyers and sellers. The body of the candle represents the conviction of the move, while the wicks represent the rejection of a price level. A long wick indicates that the price ventured into a zone but was aggressively pushed back by the opposing side, signaling a shift in power.
Consider a Bullish Pin Bar forming at a major psychological level, such as 1.1000 on the EUR/USD. The price drops sharply, piercing the 1.1000 mark, but then recovers rapidly to close near the top of the candle. This movement tells you that the market tested a liquidity zone, found an abundance of buy orders, and rejected the lower prices. The long lower wick is a visual representation of institutional buying pressure, suggesting that the downside is limited.
Support and Resistance Flip Zones
Support and resistance are not thin lines; they are zones of supply and demand. A flip occurs when a previously established ceiling, or resistance, is broken and then tested from above, becoming a floor, or support. This shift indicates a fundamental change in market sentiment and the redistribution of liquidity.
In a break-and-retest scenario, imagine the USD/JPY pair breaking above a strong resistance level at 145.00. Instead of chasing the breakout—which often leads to buying at the top—a price action trader waits for the price to return to the 145.00 zone. If the price touches this level and bounces upward, the old resistance has flipped to new support. This confirms that the market now views 145.00 as a fair value for buyers to enter, providing a high-probability entry point with a clear stop-loss placed below the zone.
Market Structure: Higher Highs and Lower Lows
Market structure is the foundation of trend identification and the primary tool for avoiding trades against the momentum. An uptrend is defined by a sequence of higher highs (HH) and higher lows (HL). Conversely, a downtrend is characterized by lower highs (LH) and lower lows (LL). When this sequence breaks, it signals a potential change in the overall market regime.
For example, if the AUD/USD is in a clear uptrend, you will see the price peak, pull back, and then push to a new high. The moment the price fails to make a new high and instead drops to break the previous higher low, the market structure has shifted. This break of structure (BOS) suggests that the bullish momentum has exhausted and the market may be entering a bearish phase or a prolonged period of range-bound consolidation. Recognizing this shift early prevents the trader from trying to buy a falling knife.
Chart Patterns: Flags, Pennants, and Head and Shoulders
Patterns are visual representations of price action cycles and the psychological state of market participants. Flags and pennants are continuation patterns that signal a brief pause in a strong trend before the move resumes. Head and Shoulders patterns are reversal signals that indicate a shift in the balance of power between bulls and bears.
Imagine a strong rally in the GBP/USD. The price moves vertically, then begins to drift slightly downward in a narrow, parallel channel, forming a bull flag. This indicates that buyers are absorbing the selling pressure without letting the price collapse. Once the price breaks the upper boundary of the flag, it often triggers a second wave of buying. Conversely, a Head and Shoulders pattern on a daily chart suggests that the market attempted to push higher twice but failed, signaling that the trend is losing steam and a reversal is likely.
Step-by-Step Guide to Reading Price Action
Step 1: Identify the Higher Timeframe Trend
Before looking at individual candles or lower timeframe noise, determine the dominant direction on a higher timeframe (HTF), such as the Daily or 4-Hour chart. This prevents you from fighting the overall momentum of the market. Look for the sequence of highs and lows. If the Daily chart shows a series of higher highs and higher lows, your bias is bullish. You are now looking for buying opportunities on lower timeframes, rather than trying to pick a top in a strong bull market.
Step 2: Map Key Supply and Demand Zones
Identify the areas where price has historically reacted with high volatility. Look for swing highs and swing lows where the price sharply reversed. Mark these as zones rather than exact lines, as institutional orders are often spread across a small range. Pay close attention to psychological levels, such as round numbers like 1.0000 or 1.2000, and previous session highs or lows. These are the areas where institutional liquidity is most concentrated and where the most significant price reactions occur.
Step 3: Wait for a Price Action Signal
Do not enter a trade simply because the price reached a zone. Entering blindly is gambling, not trading. Wait for a confirmation signal that proves the zone is holding and that the market is reacting as expected. This could be a pin bar, an engulfing candle, or a fake-out, where the price briefly breaks a level and immediately reverses. For example, if the price hits your support zone on the 1-hour chart, wait for a bullish engulfing candle to close. This proves that buyers have actually stepped in and are defending the level.
Step 4: Define the Invalidation Point and Target
Before clicking buy or sell, determine exactly where your thesis is proven wrong. In price action trading, the stop-loss is typically placed just beyond the wick of the signal candle or outside the support/resistance zone. Your target should be the next logical area of liquidity—usually the next major support or resistance zone. If the potential reward is not at least twice the risk, such as a 2:1 reward-to-risk ratio, the trade is not worth taking, regardless of how good the setup looks.
Step 5: Execute and Manage the Trade
Enter the position once the signal candle closes. Avoid market-guessing the bottom or top. As the trade progresses, monitor the market structure. If the price creates a new higher low, you can move your stop-loss to break-even to remove the risk from the trade. Avoid the temptation to move your stop-loss further away to give the trade room, as this is how a small, manageable loss becomes a catastrophic drawdown that wipes out an account.
Practical Tips for Better Results
- Focus on the major pairs first. Pairs like EUR/USD, GBP/USD, and USD/JPY have the highest liquidity, which means price action patterns are more reliable and spreads are tighter, reducing the cost of trading.
- Use a top-down approach. Always analyze the Weekly, then Daily, then 4-Hour, and finally the 15-Minute chart. A signal on the 15-minute chart is essentially meaningless if it contradicts the dominant trend on the Daily chart.
- Watch the session overlaps. The London and New York overlap, typically between 8:00 AM and 12:00 PM EST, provides the highest volume and volatility. Price action signals during this window are generally more trustworthy than those during the quiet Asian session.
- Pay attention to fake-outs or liquidity grabs. Often, the price will briefly break a support level to trigger retail stop-losses before reversing sharply. This is a hallmark of institutional activity, where big players hunt for liquidity to fill their own large orders.
- Keep a clean chart. Remove all indicators except for the candles. If you cannot see the trend and the zones clearly, you are adding too much noise to your analysis.
- Treat psychological levels as magnets. Price often gravitates toward round numbers before deciding on a direction, as these levels attract a high volume of limit orders.
Common Mistakes to Avoid
- Trading in the middle of a range. Many traders try to find patterns in the chop between major zones. This leads to frequent small losses and mental frustration. Only trade at the edges of the range where the risk-to-reward is skewed in your favor.
- Over-analyzing small timeframes. Looking at 1-minute charts can lead to analysis paralysis and a distorted view of the market. The noise on a 1-minute chart often masks the true institutional trend and leads to over-trading.
- Ignoring the news calendar. While price action is the primary tool, a high-impact event like a Federal Reserve interest rate decision or a Non-Farm Payroll (NFP) report can invalidate any technical setup in seconds. Always check the economic calendar before taking a position.
- Chasing the move. Entering a trade after a massive candle has already pushed the price far from the support zone ruins your risk-to-reward ratio. If you missed the entry, wait for the retest of the zone.
- Confusing a pullback with a reversal. A temporary dip in an uptrend is a buying opportunity, not a signal to go short. Always check the market structure and the sequence of higher highs and higher lows before assuming the trend has changed.
How do I start learning price action trading?
Start by observing raw charts without any indicators. Practice identifying the trend by marking higher highs and lower lows and mapping historical support and resistance zones. Spend significant time on a demo account identifying rejection candles at these zones before risking real capital. The goal is to develop a visual eye for how price behaves at key levels.
What is the difference between price action and technical analysis?
Technical analysis is a broad umbrella that includes everything from Fibonacci retracements and Elliott Wave theory to lagging indicators like the MACD. Price action is a specific subset of technical analysis that focuses exclusively on the raw movement of price and the psychology behind the candles. While technical analysis uses tools to interpret price, price action looks at the price itself.
Why is price action considered more accurate than indicators?
Indicators are lagging; they tell you what happened in the past based on a mathematical formula. Price action is leading; it shows you what is happening in real-time. By focusing on the price, you are observing the direct result of buy and sell orders hitting the market, rather than a mathematical average of those orders.
When is the best time to use price action strategies?
Price action is most effective during high-liquidity sessions, specifically the London and New York overlaps. It is also highly effective during trending markets and at the extremes of long-term ranges where institutional reversals typically occur.
Can I trade Forex using only price action?
Yes, many professional traders use a naked chart approach. However, this requires a high level of discipline and a deep understanding of market structure. Combining price action with a basic understanding of fundamental drivers, such as central bank monetary policy and interest rate differentials, usually yields better results.
Is price action trading suitable for beginners?
It is highly suitable because it teaches the core mechanics of how markets move. However, it requires more patience than indicator-based trading because you must wait for specific price behaviors to manifest rather than waiting for a line to cross. It forces the trader to develop a disciplined mindset.
Conclusion
The core lesson of price action is that the chart is a map of human psychology and institutional intent. Indicators are helpful tools for some, but they are secondary to the price itself. By focusing on market structure, rejection wicks, and the flip of support and resistance zones, you move from guessing where the market might go to reacting to what the market is actually doing.
Your next practical step is to open a chart of a major pair, such as EUR/USD, and identify the last three major flip zones where resistance became support or vice versa. Observe how the price reacted at those levels and how long it took for the trend to resume.
Trading forex involves significant risk of loss. Price action increases your probability of success, but it does not guarantee profits. Always use a stop-loss, maintain a strict position sizing plan, and never risk more than a small percentage of your account on a single trade.
*
Disclaimer: Trading foreign exchange on margin carries a high level of risk and may not be suitable for all investors. The high degree of leverage can work against you as well as for you. Before deciding to invest in foreign exchange, you should carefully consider your investment objectives, level of experience, and risk appetite.
—
This article is for educational purposes only and does not constitute investment advice. Trading and investing carry risk of loss; never invest more than you can afford to lose.
Last reviewed: August 2026