Using Bollinger Bands to Trade: Strategies That Work

Table of Contents
- Introduction
- What Is Using Bollinger Bands?
- Why Using Bollinger Bands Matters for Traders and Investors
- Core Concepts
- Step-by-Step Guide
- Practical Tips for Better Results
- Common Mistakes to Avoid
- Frequently Asked Questions
- Conclusion
Introduction
Consider a trader monitoring the S&P 500 during a prolonged period of extreme consolidation. Price action is flat, volume is drying up, and the market feels stagnant. Suddenly, a macroeconomic catalyst hits, and the index rips through a key resistance level with massive momentum. A trader relying solely on a static support line or a lagging oscillator might enter the trade too late, missing the meat of the move. Conversely, the trader using bollinger bands identified the volatility squeeze days prior and was positioned for the breakout before the crowd.
The primary hurdle for most retail traders is the tendency to treat technical indicators as binary signals or magic buttons. They see a price touch the lower band and immediately execute a buy order, only to watch the price slide further down in a powerful downtrend. This failure occurs because they confuse a volatility boundary with a hard floor. In a high-momentum regime, the bands do not act as walls; they act as highways.
Understanding the nuanced relationship between price, the mean, and volatility is the difference between a lucky guess and a repeatable, professional process. This guide explains how to move beyond basic signals to integrate volatility expansion and contraction, providing a rigorous framework for trend confirmation and mean-reversion trades.
What Is Using Bollinger Bands?
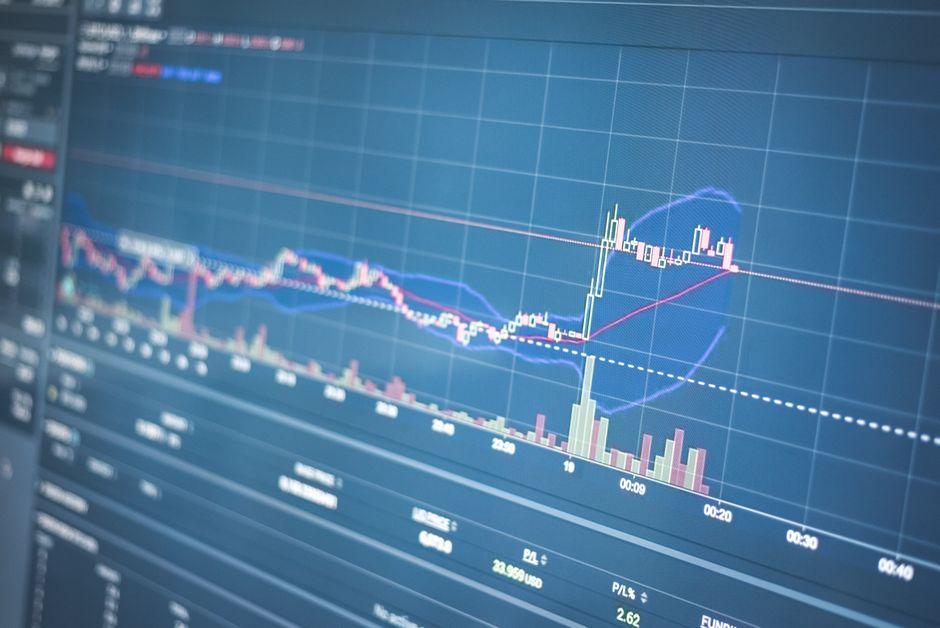
Using bollinger bands involves applying a volatility-based envelope around a central price average. Developed by John Bollinger, the tool consists of three distinct components: a Simple Moving Average (SMA)—typically set to 20 periods—and two outer bands plotted at a set number of standard deviations (usually two) above and below that average.
Because these bands are derived from standard deviation, they are dynamic. They expand when the market becomes volatile and contract when the market is quiet. For example, if you are tracking the EUR/USD on a 15-minute chart, the bands will widen significantly during the New York session open as liquidity and volatility spike. Conversely, they will narrow during the late Asian session when trading volume drops and the price enters a low-volatility drift.
Unlike a standard moving average, which only tells you where the price has been, the bands provide a visual representation of the current volatility regime. This allows a trader to quantify whether the current price action is an outlier or within the expected statistical range of the asset’s recent movement.
Why Using Bollinger Bands Matters for Traders and Investors
Most technical indicators provide a lagging view of price action. While bollinger bands are technically lagging because they rely on a moving average, they provide a real-time visualization of the volatility regime. This allows a trader to determine whether they should be deploying a trend-following strategy or a mean-reversion strategy.
Ignoring volatility often leads to the fatal error of applying a range-bound strategy during a parabolic move. For instance, attempting to short a stock like NVIDIA simply because it touched the upper band during a massive AI-driven rally is a recipe for a significant drawdown. In such a scenario, the bands indicate that volatility is expanding, which suggests the trend has genuine strength rather than being overextended.
Institutional researchers and quantitative analysts use these boundaries to identify statistical extremes. When price moves beyond two standard deviations, it is historically considered an outlier. For a professional, this is not necessarily a signal to trade against the trend, but rather a signal that the current move is accelerating. By monitoring the width of the bands, a trader can gauge the internal strength of a move and adjust their position sizing accordingly.
The Bollinger Squeeze and Volatility Breakouts
The Squeeze occurs when the upper and lower bands tighten to a level not seen in several weeks or months. This indicates a period of extremely low volatility and a compression of price action. Markets naturally move from periods of low volatility to high volatility; therefore, a squeeze is often the precursor to a violent move.
Consider a scenario with AAPL on a daily chart. The price has been churning in a tight 2% range for ten days, and the bands have constricted. A professional trader does not guess the direction of the breakout. Instead, they wait for a candle to close outside the upper or lower band, ideally accompanied by a spike in volume. If the price closes above the upper band, the squeeze has fired to the upside, signaling the birth of a new trend. The primary risk here is the head-fake, where the price pokes outside the band and immediately reverses, trapping breakout buyers.
W-Bottoms and M-Tops (Double Bottom/Top Confirmation)
A common retail error is buying the first touch of a lower band. Professional analysis looks for a W-Bottom, which is a two-step confirmation of a reversal. The first leg of the W touches or exceeds the lower band, followed by a slight bounce. The second leg of the W drops again, but this time the price stays inside the lower band.
This creates a bullish divergence: the price is making a similar low, but the volatility boundary has shifted upward, meaning the second drop is less extreme than the first. For example, in a gold (XAU/USD) swing trade, you might see the price hit the lower band at $2,000, bounce to $2,020, and then drop to $2,005. Because $2,005 is inside the lower band, the selling pressure is exhausting. This provides a much higher-probability entry than simply buying the first touch of the band.
Walking the Bands during Strong Trends
In a powerful trend, price does not bounce off the outer bands; it walks along them. This occurs when the price stays pinned to the upper band in an uptrend or the lower band in a downtrend for an extended period. This is a sign of extreme momentum and strength, not a signal that the asset is overbought or oversold.
Imagine a crypto asset in a bull run. The price hits the upper band and stays there for five consecutive 4-hour candles. A novice trader would short this, believing the price must return to the mean. A professional recognizes this as walking the bands and remains long, using the 20-period SMA as a trailing stop. The trade only ends when the price closes back inside the bands and crosses the SMA, signaling that the momentum has finally shifted and the trend is exhausting.
Step-by-Step Guide
Step 1 — Identify the Market Regime
Before applying any specific strategy, you must determine if the market is trending or ranging. The most reliable way to do this is by observing the slope of the 20-period SMA. If the SMA is flat, you are in a range-bound environment where mean-reversion—buying the bottom band and selling the top—is more likely to be profitable. If the SMA is angled sharply up or down, you are in a trend, and you should avoid trading against the bands.
Step 2 — Set the Volatility Filter
Analyze the width of the bands to determine the current volatility state. If the bands are wide, the market is in a high-volatility state, and your stop-loss needs to be wider to avoid being stopped out by random noise. If the bands are narrow, you are witnessing a squeeze and should be looking for a breakout. Decide your trigger: will you enter on the first close outside the band, or will you wait for a retest of the band from the outside to confirm the new level of support or resistance?
Step 3 — Execute the Entry with Confirmation
Avoid entering a trade based on a band touch alone. Use a secondary confirmation tool to increase your win rate. For a long trade at the lower band, look for a bullish engulfing candle or a positive divergence on the RSI (Relative Strength Index). If you are trading a squeeze breakout, ensure the breakout candle is supported by higher-than-average volume. This confirms that institutional liquidity is driving the move, rather than a few fragmented retail orders.
Step 4 — Define the Exit and Risk Parameters
Set your stop-loss based on the current volatility rather than a fixed pip or dollar amount. In a mean-reversion trade, the stop usually goes below the recent swing low or a specific percentage beyond the lower band. For a trend-following trade where you are walking the bands, the 20-period SMA is the logical exit point. If the price closes on the opposite side of the SMA, the trend has likely broken, and the position should be closed to protect capital.
Practical Tips for Better Results
- Combine bands with volume. A breakout from a squeeze without a corresponding volume spike is often a bull or bear trap.
- Use multiple timeframes for confluence. A squeeze on the daily chart is far more significant and carries more weight than a squeeze on a 5-minute chart.
- Adjust the standard deviation for different asset classes. For highly volatile assets like small-cap stocks or altcoins, using 2.5 standard deviations can reduce the number of false signals and filter out noise.
- Watch the mid-line (SMA). In a strong trend, the mid-line often acts as dynamic support or resistance, providing an ideal area for adding to a winning position.
- Do not trade the bands in isolation. Always check the broader macroeconomic context, such as major SEC announcements, Federal Reserve interest rate decisions, or Treasury yield shifts, which can override any technical pattern.
- Use the bands to set realistic profit targets. In a range-bound market, the opposite band is the most logical and statistically probable target.
Common Mistakes to Avoid
- Treating the bands as absolute support or resistance. Bands are dynamic and move in tandem with price; they are not static horizontal levels.
- Buying the lower band during a crash. During a liquidity crisis or a black swan event, prices can ride the lower band down for a long time. Attempting to catch a falling knife in this environment can lead to catastrophic losses.
- Over-optimizing the period. Changing the 20-period SMA to 18 or 22 rarely changes the outcome of a trade. The core logic of the indicator remains the same regardless of minor tweaks.
- Ignoring the slope of the SMA. Trading mean-reversion when the SMA is steeply angled against you is a high-risk move that often leads to significant account drawdowns.
- Using excessive leverage on squeeze trades. Breakouts can be violent and volatile. If your position size is too large, a small retracement can trigger a margin call before the main move happens.
How do I set the best period for Bollinger Bands?
The industry benchmark is a 20-period SMA with 2 standard deviations. This setting works effectively across most timeframes. You can shorten the period to 10 for faster signals when scalping or lengthen it to 50 for a smoother, long-term view of volatility and trend.
What is the difference between Bollinger Bands and Keltner Channels?
Bollinger Bands use standard deviation, which measures the dispersion of price from the average. Keltner Channels use Average True Range (ATR), which measures the absolute distance of price movement. Consequently, Bollinger Bands react more sharply to sudden spikes in volatility, while Keltner Channels provide a smoother, more consistent envelope.
Why do prices sometimes stay at the outer bands during a trend?
This phenomenon is known as walking the bands. It occurs when the momentum is so strong that the price pushes the standard deviation higher. In these instances, the outer band is not a ceiling but a reflection of an accelerating trend and increasing buying or selling pressure.
When is the best time to exit a Bollinger Band trade?
For mean-reversion trades, the exit is typically the 20-period SMA or the opposite band. For trend-following trades, the exit occurs when the price closes back inside the bands and crosses the SMA, indicating that volatility is contracting and the trend is likely ending.
Can Bollinger Bands be used for day trading?
Yes, they are highly effective on 5-minute and 15-minute charts for identifying intraday squeezes. However, day traders must account for the opening range volatility. Bands often widen rapidly in the first hour of trading, making signals less reliable until the market settles into a clearer direction.
Is a 20-period SMA the only way to use Bollinger Bands?
No. Some traders prefer an Exponential Moving Average (EMA) instead of an SMA to give more weight to recent price action. This makes the bands more responsive to sudden shifts, though it can also increase the number of false signals by reacting to short-term noise.
Conclusion
The most critical lesson when using bollinger bands is that they are a tool for measuring volatility, not a crystal ball for predicting price. The bands tell you when the market is quiet and when it is explosive. The real edge comes from recognizing the market regime—knowing when to fade the extremes in a range and when to ride the momentum in a trend.
As a next step, open a chart of a liquid asset like the S&P 500 ETF (SPY) and analyze the last three major volatility squeezes. Observe how the price behaved after the breakout and where the 20-period SMA sat during the subsequent trend. This historical analysis will help you recognize the patterns in real-time.
Trading involves significant risk of loss. No indicator, including Bollinger Bands, can guarantee profits or eliminate the risk of a drawdown. Always use stop-losses and size your positions according to your total account equity to ensure survival across different market cycles.
*
Disclaimer: Trading and investing involve substantial risk of loss. The strategies discussed in this article are for educational purposes and do not constitute financial advice. Past performance is not indicative of future results.
—
This article is for educational purposes only and does not constitute investment advice. Trading and investing carry risk of loss; never invest more than you can afford to lose.
Last reviewed: August 2026