Technical Analysis vs Trading Discipline: What Works Better?

Table of Contents
- Introduction
- What Is Technical Analysis?
- Why Technical Analysis Matters for Traders and Investors
- Core Concepts
- Step-by-Step Guide to Building Trading Discipline
- Practical Tips for Better Results
- Common Mistakes to Avoid
- Frequently Asked Questions
- Conclusion
Introduction
A trader watches a moving average crossover on Apple, enters a position, and watches the trade go against them. They add to the position hoping the signal was right. Three weeks later, the account is down 40%. The irony: the moving average crossover worked exactly as textbook definitions describe. The trader had the best technical analysis tools available. They still lost money.
This scenario plays out daily across trading desks and retail accounts worldwide. Traders spend months learning chart patterns, backtesting indicators, and studying price action. Yet research consistently shows most retail traders lose money, even when their analysis has grown increasingly sophisticated.
The reason is not that technical analysis fails. The reason is that technical analysis addresses only half the trading problem. The other half—trading discipline—determines whether a trader survives long enough to profit. Without it, one bad week wipes out months of gains.
This guide examines both skills, explains why disciplined trading consistently outperforms pure technical analysis, and shows you where to focus your development efforts.
What Is Technical Analysis?
Technical analysis is the practice of reading price charts to forecast future price movements. It operates on a core assumption: market prices reflect all known information, and historical patterns tend to repeat. Traders who use this approach study candlestick patterns, indicators like moving averages and RSI, support and resistance levels, and volume data to identify entry and exit points.
A trader might use a 50-day moving average crossing above a 200-day moving average as a buy signal. This “golden cross” suggests a long-term uptrend is establishing. The trader enters when the price breaks above both averages, expecting momentum to carry the position higher.
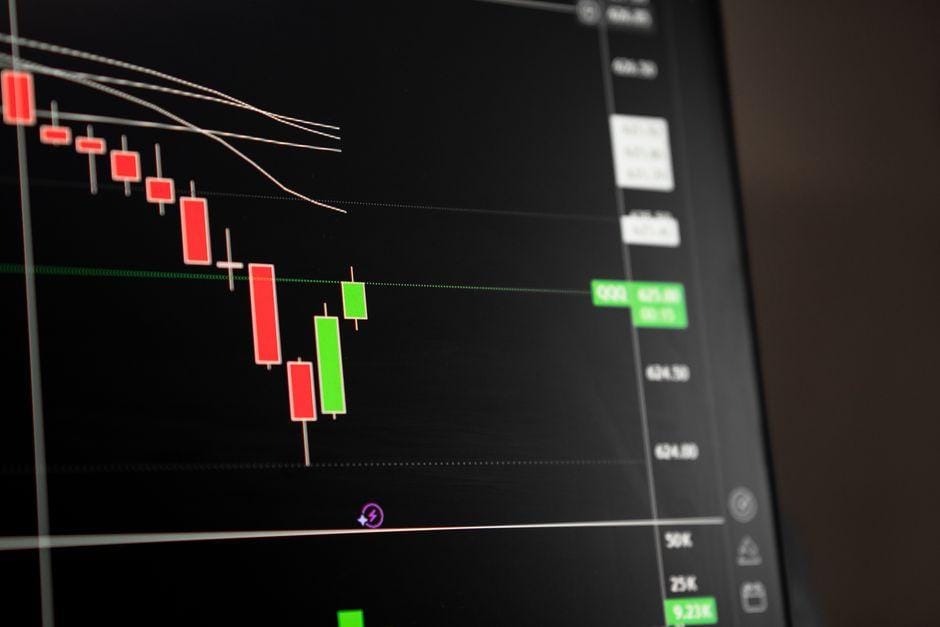
Another common approach involves reading candlestick patterns. A hammer candle, with its small body and long lower wick, often signals a reversal from bearish to bullish momentum. Traders watch for these patterns at key support levels, where buying pressure historically outweighs selling.
Technical analysis works best when market conditions align with the underlying assumptions. Trends persist, ranges contain prices, and support and resistance levels hold. When these conditions change, even the best technical signals fail. The trader who relies solely on chart patterns without position sizing rules or stop-loss discipline has no defense against these regime changes.
Why Technical Analysis Matters for Traders and Investors
Every trader uses some form of technical analysis, whether they realize it or not. Even fundamental investors check price charts before buying. The practical value lies in three areas.
First, technical analysis provides objective entry and exit rules. A trader with a clear rule—”sell when the 14-day RSI exceeds 70”—removes guesswork from decisions. This objectivity is valuable because discretionary trading invites emotional bias. The problem arises when traders follow the rule to enter but abandon it when the trade moves against them.
Second, technical analysis helps identify risk-reward setups. By plotting support and resistance levels, a trader can estimate potential profit against potential loss before entering. A stock trading at $100 with support at $95 and resistance at $110 offers a 5-to-1 reward relative to risk if buying at the support level. Without this framework, traders cannot systematically evaluate whether a trade is worth taking.
Third, technical analysis creates a shared language for markets. Institutional traders, retail traders, and algorithmic systems all react to similar chart levels. When a large number of participants watch the same moving average or support zone, that level becomes self-fulfilling—until it does not. Understanding this collective behavior helps traders anticipate liquidity and order flow.
The critical limitation is that technical analysis tells you what might happen, not what will happen. A moving average crossover has a certain probability of success, but no chart pattern guarantees a profit. Without discipline to manage risk when analysis fails, the occasional winning trade does not compensate for the inevitable losses.
Core Concepts
Support and Resistance Levels
Support and resistance levels are price zones where buying or selling pressure historically prevents further movement. A support level forms when buyers repeatedly enter at a specific price, stopping declines. Resistance forms when sellers consistently take profits or short positions at a higher price.
Consider a stock that repeatedly bounces off $50 over several months. Each time price approaches $50, volume increases as buyers accumulate. The $50 level becomes support. A trader might enter long positions near $50 with a stop-loss slightly below, perhaps at $48, risking $2 per share to capture a potential move toward $55 or $60.
The problem occurs when the level breaks. In volatile markets, support and resistance frequently fail. A stock that held $50 for months may gap through it on bad news, leaving no opportunity to exit at the planned stop-loss. Traders without discipline to accept the loss and move on often hold positions hoping the level will reassert. This hope, combined with absence of position sizing rules, destroys accounts.
Emotional Trading Psychology
The psychological challenges of trading are well-documented but rarely mastered. Fear and greed drive the two most destructive behaviors: taking profits too early and holding losers too long.
Fear manifests after a trader experiences a significant loss. The next setup that appears looks similar to the losing trade. The trader hesitates, shrinks position size, or skips the trade entirely. Then the market moves in the expected direction without them. The pattern repeats: fear of losing money causes missing profitable trades, which causes frustration, which leads to overtrading to make up for missed opportunities.
Greed appears as increased position size after a winning streak. A trader makes five consecutive profitable trades using their technical system. Confidence builds. They double position size on the sixth trade. The trade goes against them. One oversized position wipes out the previous five profits plus capital.
Emotional trading psychology explains why most traders fail despite having profitable strategies. The strategy works on paper. Human emotion destroys it in real time. Trading discipline addresses this by enforcing mechanical rules that override emotional impulses.
Risk-Reward Ratio Calculation
The risk-reward ratio measures potential profit against potential loss for any given trade. A trader buying at $100 with a stop-loss at $95 and a target at $115 is risking $5 to gain $15—a 1-to-3 risk-reward ratio. Over a series of trades, profitability depends on win rate multiplied by average reward relative to average risk.
A trader with a 1-to-3 risk-reward ratio needs only a 25% win rate to break even. With a 40% win rate, the trading edge becomes substantial. This mathematics is simple. The application requires discipline.
Many traders place stops based on chart levels without calculating whether the potential reward justifies the risk. They enter trades where the risk-reward ratio is 1-to-1 or worse, requiring a win rate above 50% just to break even. Over time, transaction costs and occasional large losses make this approach unprofitable.
Others calculate the ratio correctly but abandon it when trades move against them. They move stop-losses further from entry, increasing risk. Or they exit winners early because the trade “feels risky,” converting a 1-to-3 setup into a 1-to-1 outcome. Discipline means following the rules regardless of how the trade feels in the moment.
Position Sizing Algorithms
Position sizing determines how much capital to risk on any single trade. Proper position sizing protects capital during losing streaks and allows growth during winning periods. The most common approach risks a fixed percentage of account equity on each trade—typically 1% to 2%.
A trader with a $100,000 account and a 2% risk rule risks $2,000 per trade. If the stop-loss is $2 per share, the position size is 1,000 shares. If the stop-loss is $5 per share, the position size drops to 400 shares. The dollar risk remains constant regardless of the stock price or the trader’s confidence level.
Consider two traders using the same moving average crossover system on the same stock. Trader A risks 10% of the account on each signal. Trader B risks 2%. After five consecutive losing trades—a normal occurrence in any system—Trader A has lost 50% of capital and needs a 100% return just to break even. Trader B has lost 10% and needs only 11% to recover.
The difference is not skill. It is position sizing discipline. Trader A either lacked the discipline to use a small position size or lacked the capital to survive the normal losing streak. Either way, the result is account destruction.
Market Sentiment Indicators
Market sentiment indicators measure the overall mood of market participants. The VIX Index, often called the fear gauge, tracks implied volatility of S&P 500 options. When the VIX spikes, it indicates fear and uncertainty. When it collapses, it suggests complacency.
A trader might use the VIX to adjust their approach. High VIX values suggest trending markets and increased risk of large moves. Low VIX values suggest range-bound conditions where mean-reversion strategies perform better. This context helps traders choose which technical signals to act upon.
The limitation of sentiment indicators is the same as all technical analysis: they suggest probabilities, not certainties. A high VIX might precede a sharp decline, but it might also simply reflect temporary uncertainty that resolves upward. Traders who use sentiment indicators without discipline to manage risk will eventually experience the scenario where the indicator was “right” but the trade still lost money.
Step-by-Step Guide to Building Trading Discipline
Step 1: Define Your Position Sizing Rule
Before placing any trade, establish your position sizing rule. Most successful traders risk between 1% and 2% of account equity per position. Write this rule down. Commit to following it regardless of conviction level or recent results.
Calculate your position size before every trade. Determine your stop-loss level first, then calculate shares to buy or sell that result in your target dollar risk. Never reverse this process by deciding how many shares to trade and then placing the stop-loss at an arbitrary level.
Step 2: Set Concrete Entry and Exit Rules
Write specific conditions for entering and exiting trades. Avoid vague criteria like “when the stock looks ready” or “when I feel confident.” Use measurable conditions: price crossing a moving average, RSI reaching a specific level, or a candlestick pattern completing.
For exits, define your profit target and your stop-loss level before entering. Your profit target should reflect at least a 1-to-2 risk-reward ratio. Your stop-loss should reflect a technical level where your thesis is invalidated, not a level where you “hope” the trade works out.
Step 3: Track Every Trade and Review Weekly
Maintain a trading journal recording every trade: entry price, exit price, position size, reason for the trade, and emotional state. Review this journal weekly to identify patterns. Are you taking trades that violate your rules? Are you exiting winners early? Are certain setups consistently losing?
Without tracking, you cannot improve. The journal provides objective data about your behavior. It shows whether your technical analysis is working and whether your discipline is holding. Many traders discover that their analysis is fine but their execution is destroying profits.
Practical Tips for Better Results
- Use a trading plan that specifies markets, timeframes, and conditions for taking trades. Do not switch approaches based on recent results.
- Implement a maximum daily loss limit. If you lose a set amount in one session, stop trading for the day. This prevents revenge trading after losses.
- Trade smaller during high-volatility periods. Position size should account for current market conditions, not just your fixed percentage rule.
- Accept that losses are part of trading. A trader with a 40% win rate and 1-to-2 risk-reward ratio will lose 60% of trades. The discipline to stay systematic despite losses is what produces long-term profits.
- Separate analysis from execution. Make trading decisions during planning, not during market hours when emotions peak.
- Use mechanical exits for both profits and losses. Let the market decide whether you win or lose. Do not manually override stop-losses because “the stock will come back.”
- Focus on process over outcomes. A well-executed losing trade is better than a lucky winning trade. The process builds consistency; luck does not.
Common Mistakes to Avoid
- Ignoring position sizing and risking too much on single trades. One losing streak destroys the account before the strategy has time to work.
- Moving stop-losses further from entry after entering a trade. This increases risk without increasing reward, undermining the risk-reward calculation.
- Over-analyzing and seeking “perfect” setups. The best trades are good setups executed with discipline, not perfect setups that do not exist.
- Trading without a written plan. Decisions made in the moment reflect emotion rather than analysis.
- Holding losing positions in hope of recovery. Hope is the most expensive emotion in trading. Cut losses quickly and move to the next setup.
- Changing strategies after losses. If your technical analysis has a positive expectancy, stick with it through normal losing streaks.
- Chasing price after missing an entry. The market provides opportunities daily. Do not force trades because you feel you “missed out.”
Frequently Asked Questions
What is technical analysis in simple terms?
Technical analysis is reading price charts to predict where a stock or asset will go next. Traders look at past prices, volume, and indicators like moving averages to find patterns that tend to repeat. The goal is to identify high-probability entry and exit points based on historical behavior.
Is technical analysis better than fundamental analysis?
Neither is inherently better. Fundamental analysis examines financial statements, earnings, and business fundamentals to find undervalued companies. Technical analysis focuses on price action and market behavior. Many successful traders combine both approaches. Pure technical analysis works for shorter timeframes and liquid markets; fundamental analysis provides context for longer-term positions.
Can technical analysis predict stock movements?
Technical analysis cannot predict exact prices or timing. It identifies probabilities based on historical patterns. A head-and-shoulders pattern suggests a downward reversal, but the stock might continue higher instead. Technical analysis provides an edge over random guessing; it does not guarantee outcomes.
How do I learn technical analysis for beginners?
Start with one timeframe and one indicator. Learn how price behaves around moving averages, support and resistance, and basic candlestick patterns. Practice on historical charts before trading real money. Keep a journal of your analysis and compare your predictions to actual outcomes. Build competence with simple tools before adding complexity.
What are the risks of relying solely on technical analysis?
The main risk is overconfidence in chart patterns that have limited predictive value. Technical analysis ignores fundamental factors that can override chart patterns overnight. A stock with a perfect bullish setup can gap down on earnings disappointment. Without discipline to manage risk when analysis fails, traders lose capital faster than they expect.
Does trading discipline improve profitability?
Trading discipline is the primary factor separating consistently profitable traders from those who lose money. Even excellent technical analysis produces losses part of the time. Discipline ensures those losses remain manageable through proper position sizing and stop-loss rules. Without discipline, a winning strategy becomes a losing account.
Conclusion
Technical analysis provides the framework for identifying trades. Trading discipline ensures you survive long enough to profit from that framework. The evidence is clear: traders who master position sizing, risk-reward calculations, and emotional control outperform those who only study chart patterns.
The practical next step is simple. Write down your position sizing rule, your entry criteria, and your exit rules today. Review these rules before every trading session. Track every trade in a journal. Measure your results not by individual trade outcomes but by whether you followed your process.
Trading involves real risk of loss. No strategy or discipline guarantees profits. What discipline provides is the ability to participate in markets over the long term, absorbing normal losses while capturing the gains that profitable setups eventually produce. That longevity is what separates traders who build wealth from those who keep starting over.
—
This article is for educational purposes only and does not constitute investment advice. Trading and investing carry risk of loss; never invest more than you can afford to lose. Last reviewed: August 2026.