Technical Analysis Strategies for Day and Swing Trading

Table of Contents
- Introduction
- What Is Technical Analysis?
- Why Technical Analysis Matters for Traders and Investors
- Core Concepts
- Step-by-Step Guide
- Practical Tips for Better Results
- Common Mistakes to Avoid
- Frequently Asked Questions
- Conclusion
Introduction
Imagine a scenario where the Nasdaq 100 is trending upward, but a sudden spike in the VIX signals rising fear among institutional players. A trader relying solely on a general bullish sentiment might buy the dip, only to find the asset trapped in a tightening range with declining volume. This is where a mechanical approach to the charts separates those guessing from those calculating.
The primary problem for most retail traders is not a lack of tools, but a lack of timeframe alignment. Using a 5-minute chart signal to justify a three-week swing trade is a recipe for significant drawdowns. Because market regimes shift rapidly—moving from trending to mean-reverting—you need a framework that adapts to the specific velocity of the asset you are trading.
This analysis provides a comparative framework for applying technical analysis across different timeframes. We will contrast high-frequency day trading signals with the structural setups required for swing trading, focusing on the mechanics of price action and liquidity. By understanding how to read the tape and identify structural shifts, a trader can move from reactive gambling to proactive risk management.
What Is Technical Analysis?
Technical analysis is the study of historical market data, primarily price and volume, to identify patterns that suggest a higher probability of future price movement. Unlike fundamental analysis, which looks at earnings reports, interest rate decisions from the Federal Reserve, or macroeconomic data, technical analysis assumes that all known information is already priced into the asset.
The core philosophy is that price action discounts everything. If a company releases a positive earnings report but the stock price fails to break above a specific level, the technical analyst views that price as a ceiling or resistance zone. They do not ask why the news didn’t move the price; they simply observe that the sellers are more aggressive than the buyers at that specific level.
In essence, technical analysis is the study of crowd psychology. It tracks the footprints of institutional money—the “smart money”—by observing where they accumulate positions and where they distribute them. While fundamentals tell you what an asset should be worth, technicals tell you what the market is actually willing to pay for it at this exact moment.
Why Technical Analysis Matters for Traders and Investors
Technical analysis provides a repeatable set of rules for entry and exit. Without these rules, trading becomes a series of emotional reactions to flashing numbers on a screen. For a day trader, technicals allow for the identification of micro-trends that last only an hour. For a swing trader, they reveal the broader structural health of an asset over weeks.
Ignoring technicals often leads to catching a falling knife. A fundamental investor might believe a company is undervalued at $100, but technical analysis might show a breakdown of a major support level, suggesting the asset could slide to $70 before finding a floor. By ignoring the chart, the investor enters too early and suffers an avoidable drawdown.
Furthermore, technical analysis allows for precise risk management. By identifying a clear level where a thesis is invalidated, a trader can set a stop-loss that protects their capital. This transforms trading from a game of hope into a game of probabilities. When you combine a fundamental thesis with a technical entry, you are essentially using the fundamentals to pick the horse and the technicals to time the race.
Candlestick Pattern Recognition
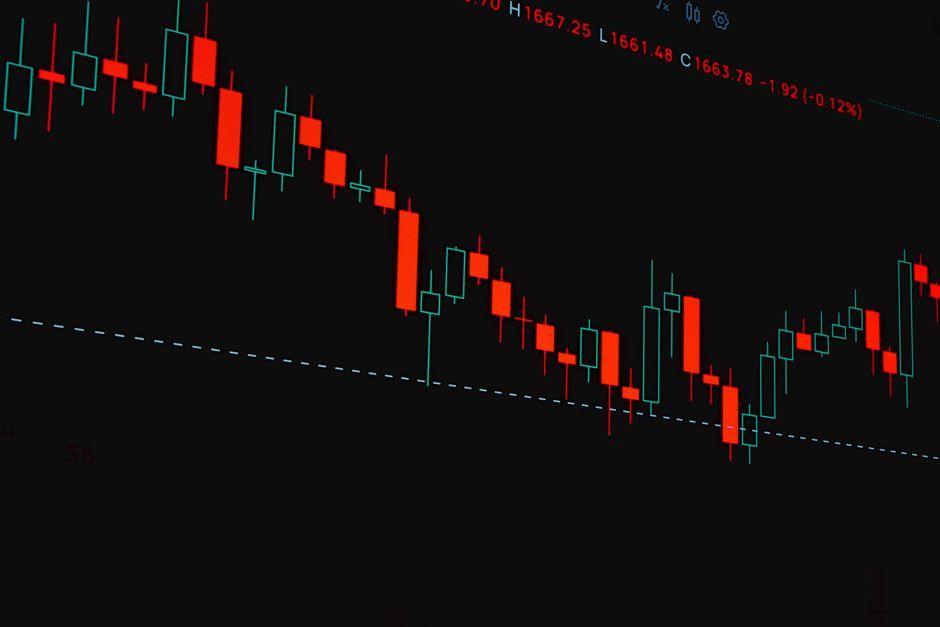
Candlesticks condense four data points—open, high, low, and close—into a single visual representation. Patterns like the Doji, Engulfing, and Hammer signal shifts in sentiment by showing where the battle between buyers and sellers ended.
In a day trading scenario, imagine a 5-minute chart of an equity where the price has been dropping sharply. Suddenly, a Hammer candle forms—a small body with a long lower wick—touching a known liquidity zone. This suggests that while sellers pushed the price down, buyers stepped in aggressively to push it back up before the candle closed. This shift in momentum often precedes a short-term reversal.
Understanding the nuance of these candles is vital. A Hammer at the top of a rally is meaningless, but a Hammer at a major support level is a high-probability signal. The key is the context. Traders look for these patterns to confirm that the momentum is shifting, providing a visual cue that the previous trend is losing its grip on the market.
Support and Resistance Flip Zones
Support and resistance are not thin lines, but zones of high order flow. A flip occurs when a previous ceiling (resistance) becomes a floor (support) after a breakout.
Consider a swing trade on an S&P 500 ETF. The price hits a resistance zone at $450 three times and fails. Eventually, a strong volume surge pushes the price to $460. When the price eventually drifts back down to $450, it doesn’t crash through; instead, it bounces. The old resistance has flipped to support. A trader would look for a long entry at this flip zone, placing a stop-loss just below the zone to limit risk.
These flip zones are critical because they represent a shift in the perceived value of the asset. When a resistance level is broken, the sellers who were defending that level are forced to cover their positions, and new buyers enter, creating a new base of support. Identifying these zones allows a trader to enter a trend with a high reward-to-risk ratio.
Momentum Oscillators (RSI and MACD Divergence)
Oscillators like the Relative Strength Index (RSI) and Moving Average Convergence Divergence (MACD) measure the speed and change of price movements. Divergence occurs when the price makes a new high, but the oscillator makes a lower high, signaling that the trend is losing steam.
In practice, you might see a cryptocurrency making a new peak on the daily chart, but the RSI is trending downward. This bearish divergence suggests that the buying pressure is exhausting. While the price is still rising, the internal momentum is fading, which often warns a swing trader to tighten their stops or take partial profits before a correction occurs.
It is important to remember that oscillators are not predictive on their own. An RSI can stay overbought for weeks during a strong bull market. The real value of these tools lies in divergence. When price and momentum disagree, the momentum usually wins in the end, providing a warning signal that the current trend is fragile.
Fibonacci Retracement Levels
Fibonacci tools are used to identify potential reversal points during a correction. The 61.8% and 38.2% levels are historically observed as areas where assets often find support during an uptrend.
Imagine a stock rallies from $10 to $20. It then begins to pull back. A trader uses a Fibonacci tool to find the 50% retracement level at $15. If the price hits $15 and forms a bullish candlestick pattern, the trader has a high-probability entry point that aligns with the overall trend. The target would be the previous high of $20 or a Fibonacci extension beyond it.
These levels work because of a self-fulfilling prophecy. Thousands of institutional algorithms and retail traders are looking at the same Fibonacci levels. When the price hits the 61.8% golden ratio, a massive amount of buy orders are often triggered, creating the very support the traders were looking for.
Volume Profile and Order Flow Analysis
Volume profile shows the amount of volume traded at specific price levels, rather than just at specific times. This helps identify High Volume Nodes (HVNs), where the most trading occurred, and Low Volume Nodes, where price tends to move through quickly.
A day trader scalping the NASDAQ might notice the price is trading above the Volume Weighted Average Price (VWAP). If the price dips toward a High Volume Node on the 15-minute chart, the trader knows there is significant liquidity there. They may enter a long position, betting that the high concentration of previous trades will act as a magnet and support, providing a quick bounce for a scalp trade.
Unlike standard volume bars at the bottom of a chart, the volume profile gives a three-dimensional view of the market. It reveals where the “value area” is. If the price is far outside the value area, it is likely to be pulled back toward the HVN. If it is inside the value area, it will likely chop until it finds a catalyst to break out.
Step-by-Step Guide
Step 1 — Define Your Timeframe and Regime
Before opening a chart, decide if you are day trading or swing trading. A day trader focuses on the 1-minute to 15-minute charts and closes all positions by the end of the session to avoid overnight gap risk. A swing trader uses the Daily and 4-hour charts and holds positions for days or weeks.
Next, identify the market regime. Is the asset trending (making higher highs and higher lows) or ranging (moving sideways between two clear levels)? You must choose a strategy that matches the regime; using a trend-following moving average in a sideways range will result in a series of small, frustrating losses.
A trending market requires a “buy the dip” or “sell the rip” mentality. A ranging market requires a “buy the bottom, sell the top” approach. Misidentifying the regime is the most common cause of failure for novice traders.
Step 2 — Map Major Structural Zones
Start with the highest timeframe. If you are swing trading, look at the Weekly and Daily charts. Mark the obvious support and resistance zones where the price has reversed multiple times.
For a day trader, start with the Daily chart to find the big picture levels, then drop to the 1-hour chart to find the day’s expected range. Identify where the big money is likely sitting—these are the liquidity zones. If you are trading an asset near a major psychological level (like a round number), expect increased volatility and potential fake-outs.
Mapping these zones prevents you from entering a trade right into a major wall of resistance. There is no point in buying a breakout on a 5-minute chart if the Daily chart shows a massive resistance zone just 0.5% above your entry.
Step 3 — Identify the Trigger Signal
Once the price enters a zone of interest, wait for a specific trigger. Do not enter just because the price reached a line. Look for a confluence of factors: a bullish engulfing candle, an RSI divergence, and a touch of a Fibonacci level.
For example, in a swing trade on an S&P 500 ETF, you might wait for a double-bottom pattern to form on the Daily chart. The trigger is the breakout above the neckline of that double bottom. This confirms that the reversal is actually happening and isn’t just a temporary pause in a downtrend.
The trigger is the final piece of the puzzle. It is the confirmation that the market participants are reacting to the level in the way you expected. Without a trigger, you are simply guessing that the support will hold.
Step 4 — Calculate Position Sizing and Risk
Determine your stop-loss based on the technical structure, not a random percentage. If you are buying a flip zone, your stop should be placed where the technical thesis is invalidated—usually just below the support zone.
Calculate your position size so that if the stop-loss is hit, you lose only a small percentage of your total capital (e.g., 1% per trade). If your stop is $2 away from your entry and you can only afford to lose $100, you buy 50 shares. This mechanical approach removes the emotion from the trade.
Position sizing is the only part of trading you can truly control. You cannot control where the price goes, but you can control how much you lose if you are wrong. This is the difference between a professional trader and a gambler.
Step 5 — Execute and Manage the Trade
Enter the trade using a limit order to avoid slippage, especially in lower-liquidity assets. Once the trade is active, monitor it according to your timeframe. A day trader checks the 5-minute chart; a swing trader may only check the 4-hour chart twice a day.
As the price moves in your favor, move your stop-loss to break-even to remove the risk of loss. Set a take-profit target based on the next major resistance zone or a risk-reward ratio of at least 1:2. Avoid the temptation to hope for more profit by ignoring your pre-set exit rules.
Management is where most traders fail. They enter correctly but exit emotionally. By having a pre-defined exit plan, you ensure that you capture profits and cut losses before they spiral out of control.
Practical Tips for Better Results
- Use a Top-Down approach. Always analyze the higher timeframe first to ensure you aren’t trading against the primary trend. If the Weekly chart is bearish, a bullish 15-minute signal is likely a trap.
- Focus on confluence. A single indicator is a hint; three indicators pointing to the same price level is a signal. Look for the intersection of a Fibonacci level, a support zone, and a bullish candle.
- Prioritize liquidity. Trade assets with high volume (like the S&P 500 or major Forex pairs) to ensure you can enter and exit positions without significant slippage. Low-liquidity assets are prone to erratic price spikes.
- Keep a trade journal. Record why you entered, where your stop was, and the emotional state you were in. This is the only way to identify if your failures are technical or psychological.
- Respect the News Gap. Technical analysis often fails during high-impact events, such as an FOMC interest rate announcement. Reduce position sizes or move to the sidelines during these windows.
- Avoid Indicator Soup. Adding ten different indicators to a chart creates analysis paralysis. Stick to one trend tool, one momentum tool, and price action.
Common Mistakes to Avoid
- Overtrading in ranges. Trying to find a trend in a sideways market leads to chopping your account to pieces. When the market is range-bound, the best trade is often no trade.
- Ignoring the stop-loss. Moving a stop further away because you believe the price will turn around is the fastest way to a total account wipeout. A stop-loss is a non-negotiable contract with yourself.
- Revenge trading. Trying to win back a loss by increasing position size immediately after a failure often leads to larger, emotional losses. Step away from the screen after a significant loss.
- Overfitting backtests. Creating a strategy that worked perfectly on past data but fails in real-time because it was too specifically tuned to a dead market regime. Markets evolve; your strategy must be flexible.
- Trading without a plan. Entering a trade based on a feeling or a social media tip rather than a technical setup. If you cannot write down the technical reason for the trade, do not take it.
How do I start learning technical analysis?
Start by studying price action—specifically support, resistance, and trendlines—before adding indicators. Use a demo account to practice identifying patterns on real-time charts without risking capital. Focus on one asset class first to understand its specific volatility and behavior. Once you can consistently identify a trend, introduce one momentum oscillator and one volume tool.
What is the difference between technical and fundamental analysis?
Fundamental analysis examines the intrinsic value of an asset, such as earnings, debt, and management quality. Technical analysis ignores intrinsic value and focuses on the psychology of market participants as expressed through price and volume. Most professionals use a hybrid approach: fundamentals for what to buy, and technicals for when to buy.
Why do technical indicators sometimes give false signals?
Indicators are lagging; they are mathematical derivatives of past price action. In high-volatility environments or during stop hunts, price can move violently against an indicator’s signal to clear out liquidity before reversing. This is why indicators should only be used as confirmation, not as the primary reason for a trade.
When should I use a 15-minute chart versus a daily chart?
Use a daily chart to identify the overall trend and major structural levels for swing trading or long-term positioning. Use a 15-minute chart for precision timing and entry execution in day trading. If the daily chart is bearish, a bullish signal on the 15-minute chart is likely just a short-term correction within a larger downtrend.
Can technical analysis predict future price movements accurately?
Technical analysis does not predict the future; it identifies probabilities based on historical behavior. It tells you that if a certain pattern forms, the price has historically moved in a specific direction a certain percentage of the time. Risk management is required because no pattern is 100% guaranteed.
Is technical analysis effective for long-term investing?
Yes, but its application changes. Long-term investors use it to identify accumulation zones where they can add to a position at a discount. Instead of looking for 5-minute flags, they look for monthly or quarterly support levels to optimize their cost basis over several years.
Conclusion
The most critical lesson in technical analysis is that the chart is a map of human psychology, not a crystal ball. Whether you are scalping a bullish flag on a 5-minute NASDAQ chart using VWAP for confirmation or identifying a double-bottom reversal on a Daily S&P 500 ETF chart, the goal is the same: find an edge where the potential reward outweighs the risk.
Your next step should be to pick one asset and one timeframe, and map out every major support and resistance zone for the last six months. Observe how the price reacts at those levels without placing a trade. This process of observation builds the intuition necessary to recognize high-probability setups in real-time.
Trading involves significant risk of loss. No strategy, even if the technical indicators used are sophisticated, can guarantee profits or eliminate the risk of capital depletion. Always trade with money you can afford to lose and maintain a strict risk management protocol to ensure long-term survival in the markets.
*
Last reviewed: August 2026