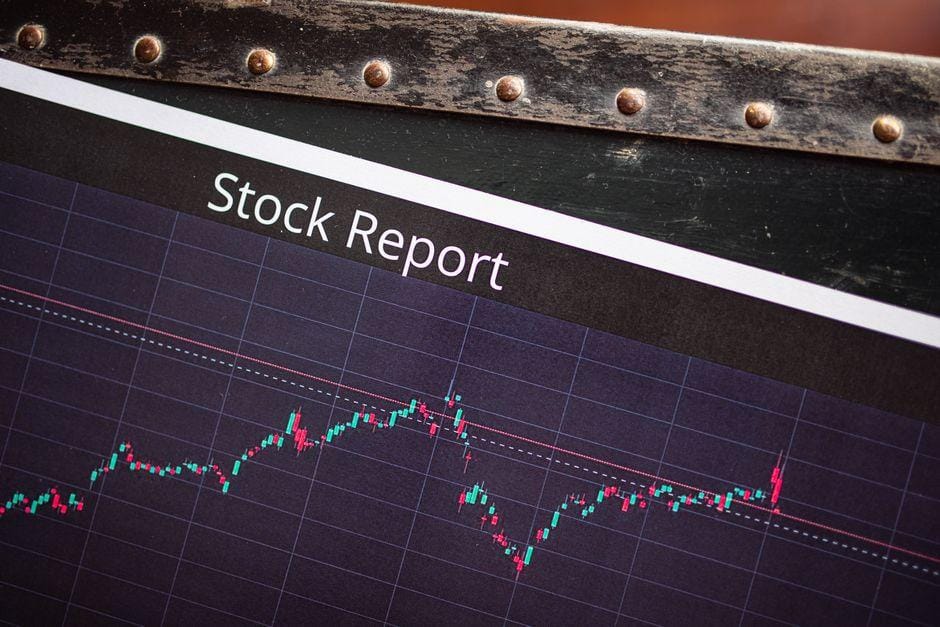
Stock Indices Price Action Analysis: Tomorrow’s Session

Table of Contents
- Introduction
- What Is Stock Indices Price Action Analysis
- Why It Matters for Traders and Investors
- Core Concepts
- Step-by-Step Guide
- Practical Tips for Better Results
- Common Mistakes to Avoid
- Frequently Asked Questions
- Conclusion
Introduction
The S&P 500 closed last week with a sharp rejection off a four-hour supply zone. Nasdaq 100 futures ground slowly higher and tagged a fresh high before fading into the close. The bond market stayed quiet. The VIX drifted. Anyone who opened a chart Sunday night saw two indices telling two different stories, and the session ahead will determine which one was real.
That is the daily reality of trading stock indices. Markets reopen, the news cycle churns, and the only thing that matters on the screen is what price actually does. Most retail traders drown in indicators and headlines. The traders who survive focus on a simpler question: what is the structure, where are the levels, and what does the next session look likely to do?
This guide is a working method for stock indices price action analysis ahead of the upcoming session. It walks through a definition, the core concepts, a step-by-step read-through, practical tips, and a short FAQ. The goal is not prediction. The goal is to walk into the next session with a framework, a plan, and a clear understanding of risk. Anyone who has stared at a candle wondering whether to pull the trigger has felt the gap between guessing and reading. This method is designed to close that gap, one session at a time.
What Is Stock Indices Price Action Analysis
Stock indices price action analysis is the practice of reading index charts — the S&P 500, Nasdaq 100, Dow Jones, Russell 2000, and the major global benchmarks — through the raw behavior of price. That means candlesticks, swing structure, key levels, and the speed and character of moves. Indicators are permitted but secondary. The price chart is the source.
In practice, an analyst using this method looks at where the index opened, where it closed, where the wicks printed, and how each session relates to the one before it. A market that prints higher highs and higher lows is trending. A market that chops inside the prior day’s range is ranging. A market that reverses violently at a known support or resistance level is responding to that level. None of that requires a moving average or an oscillator to see.
Take a concrete example. The Nasdaq 100 forms a clean uptrend on the daily chart — higher highs, higher lows, a shallow pullback to the 20-period area. On a Friday close, the index prints a wide-range bearish engulfing candle. A price action analyst flags that as a possible change in character. They do not wait for an RSI cross or a moving-average flip. They plan the next session around whether the new low holds or fails. The candle itself is the signal, the context, and the trigger.
That is the appeal of the method. The chart is the same for every participant. Hedge funds running multi-strategy books, retail traders on five-minute charts, and institutional desks managing overlay mandates all see the same open, high, low, and close. The interpretation differs, but the raw data does not. A method built on that data is portable across sessions, indices, and timeframes, and it does not require a paid feed or a proprietary indicator stack to apply.
Why It Matters for Traders and Investors
Traders use it because markets are reflexive. The level everyone watches is the level that tends to produce a reaction. When the S&P 500 reaches the prior all-time high, the air is thick with stop orders, options hedges, and nervous long positions. That order flow shows up in the candles before any news story explains it. Reading the action on the chart is the fastest way to see that pressure build or release.
Investors use it for a different reason. Most long-term investors ignore the daily noise, but a growing number use price action on the weekly and monthly charts of major indices to time entries and adjust exposure. Buying an index ETF when weekly structure is strong and momentum is expanding is a different decision from buying after a multi-week reversal off all-time highs. Both can be correct. The chart decides the context.
The risk of ignoring this is real. Traders who rely solely on news, earnings, or social media tend to enter late, hold through obvious reversal candles, and have no framework for when to step aside. Central bank meetings from the Federal Reserve, ECB rate decisions, and CPI prints move the indices, but the reaction of the chart is what tells you whether the market believes them. Price action gives the chart a vocabulary. Without it, every red day looks like a crash and every green day looks like a recovery.
The point is not that fundamentals are useless. Earnings, growth, and macro policy drive the long-term tape. But within any session, the order flow that actually prints on the screen is mechanical, reflexive, and visible. Reading that flow is the difference between trading the chart you have and trading the story you wish you had.
Market Structure: Trend, Range, and Reversal
Market structure is the spine of price action analysis. It describes the sequence of swing highs and swing lows on the chart. An uptrend is a series of higher highs and higher lows. A downtrend is lower highs and lower lows. A range is when the swings stay roughly contained between two boundaries. A reversal is when a trend breaks — the first lower low after a string of higher lows on the S&P 500 daily chart, for example.
Structure matters because it tells you what kind of session to expect. In a clean uptrend on the Nasdaq 100, pullbacks tend to be shallow and quick. Buying the dip is the higher-probability setup. In a range on the Dow Jones, fade the edges. In a reversal, sit on the hands until the new structure confirms — usually two or three sessions of lower highs after the break. Without that filter, every setup looks the same, and most of them fail.
Key Levels: Where Reactions Happen
Key levels are the horizontal prices the market has reacted to before. The usual suspects: prior day high and low, prior week high and low, all-time highs, the opening range of the current session, and round numbers like 5,000 on the S&P 500 or 18,000 on the Nasdaq 100. VWAP and prior session value area highs and lows also act as magnets on a typical session.
A level’s importance grows with the number of times price has respected it and the volume traded at it. The S&P 500 prior day high that printed heavy volume during a Federal Reserve announcement is a more meaningful level than a thin intraday pivot. Mark them on the chart before the session opens. If the index is going to react anywhere, it usually reacts there first. Levels that price has touched three or four times in three months carry more weight than levels touched once and forgotten.
Candle Behavior, Momentum, and Traps
Candles are not just decoration. A long upper wick at resistance shows rejection. A wide-range bullish engulfing on rising volume confirms accumulation. A doji at the prior day’s low warns of a possible stop hunt before a real move. Each candle is a small story about who is in control during that period.
Momentum is the speed and size of those candles. Trend days produce a string of full-bodied candles in one direction with shallow pullbacks. Range days produce small bodies, long wicks, and overlapping candles. Knowing the regime — trend or range — before the open changes everything about how the level gets traded. A breakout trade works in a trend. A fade-the-edge trade works in a range. Mixing them up is how accounts bleed, especially when liquidity at the obvious level produces a false break that traps both sides.
Step-by-Step Guide
Step 1: Set the Higher-Timeframe Context
Start with the daily and weekly chart of the index being analyzed. For the S&P 500, mark the higher-timeframe trend — is the index making higher highs and higher lows, or has it broken structure? Mark the obvious supply and demand zones from the past three months. Note where price currently sits relative to the 50-day and 200-day moving averages, not as signals but as context.
If the weekly chart is bullish and the daily chart has just pulled back into a known demand zone, the bias for the next session is up. If the weekly is choppy and the daily has rejected a supply zone twice, the bias is down or sideways. This step alone prevents the most common beginner mistake: trading a five-minute setup against the daily trend. The higher timeframe is the parent. The lower timeframe is the child. Children do not get to ignore their parents.
Step 2: Mark the Levels From the Prior Session
Open the four-hour and one-hour charts of the index futures or the relevant ETF. Mark the prior day high, prior day low, prior day close, and the overnight high and low. If the index is the Nasdaq 100, also mark the cash session opening price and the prior week’s high and low. These are the levels to watch when the cash session opens.
Do not over-mark the chart. Six to ten clean levels are enough. Every extra line on the screen is a distraction. The goal is to know, at a glance, where the index is relative to the battlefield. A clean chart is faster to read and harder to misread. Most retail charts are cluttered with retired levels that no longer matter. Strip them out.
Step 3: Read the Open and the First Hour
The first hour of the cash session reveals intent. Watch how price behaves around the opening price. Does it gap up, fail at the prior day high, and reverse? That is a tell. Does it open inside the prior day’s range and start building a base? That is a different story. Note the opening range — the high and low of the first 30 or 60 minutes — because most of the day’s reaction points will come from its edges.
Avoid trading the first five minutes unless there is a clear level and a clear setup. Liquidity is thin, spreads are wider, and the first candle often reverses. Wait for the opening range to form, then plan around its edges and the levels from Step 2. The first hour is information. The second hour is opportunity.
Step 4: Plan the Trades Before the Levels Are Hit
A plan is a list of conditions, not a list of hopes. For each level on the chart, decide in advance: if price reaches this level and shows rejection on a five-minute candle, enter with a stop below the level, targeting the opposite side of the range or the next intraday level. If price breaks the level and retests it, look for continuation. If price chops through without a clean reaction, do nothing.
Write the plan down. The market moves faster than memory, and an unwritten plan is a wish. The plan can be a sticky note, a notebook, or a line in a trading journal. What matters is that the conditions are on paper before the level gets hit. The best trades are the ones that feel boring in the moment because the work was done the night before.
Practical Tips for Better Results
- Trade the reaction, not the breakout. Many breakouts fail on indices because the order book at the obvious level is already loaded. Wait for the wick and the reclaim.
- Stack confluence. A level is stronger when it sits on a higher-timeframe supply or demand zone, aligns with the daily VWAP, and coincides with a prior swing high. One reason to enter is a gamble. Three is a trade.
- Use the VIX as a regime filter. Rising VIX with falling indices confirms risk-off behavior. A falling VIX during an index pullback often means the dip is buyable. When the VIX spikes and holds above its 20-period moving average, mean-reversion setups get dangerous.
- Size for the level, not the conviction. Tight levels with clear invalidation deserve larger size. Wider levels or choppy contexts deserve smaller size. The best traders are boring about position sizing.
- Respect the session close. The last 30 minutes of cash often determines the overnight tone. A close at the low of the day with the S&P 500 below the prior day low changes the plan for the next open.
- Keep a screenshot log. Screenshot the chart before the session, mark what was expected, and compare to what happened. The gap between expectation and reality is where edge is built.
Common Mistakes to Avoid
- Trading the open blind. The first candle often lies. Wait for the opening range, then react.
- Ignoring the higher-timeframe trend. A long setup on a five-minute chart inside a daily downtrend usually loses. The bigger timeframe is the parent. Respect it.
- Overtrading a chop day. Some sessions produce one or two clean setups. Most produce none. Sitting on the hands is a position.
- Moving the stop after a loss. Either the level was wrong or the size was wrong. The fix is not a wider stop.
- Treating every level the same. A prior all-time high and a thin intraday pivot are not equal. Weight them by the volume and time that produced them.
- Trading through major news without a plan. CPI, FOMC decisions, and NFP prints can move the S&P 500 by a percent in minutes. Decide before the print whether to trade or stand aside.
Frequently Asked Questions
What Is Price Action in Stock Indices?
Price action in stock indices is the study of how an index chart moves over time, using candles, swing structure, and key levels rather than lagging indicators. The aim is to read the order flow visible in the price itself and anticipate the next likely session behavior.
How Do You Read Price Action for the Next Session?
Start with the daily and weekly structure. Mark the prior day, prior week, and overnight levels. Watch the first hour of the cash session for a reaction at those levels. Plan trades around the edges of the opening range and only enter when the candles confirm a rejection or a continuation.
Is Price Action Better Than Indicators?
Neither is inherently better. Indicators are derived from price, so they always lag. Price action reads the source directly and is faster, but it takes practice. Many experienced traders use a small set of indicators — usually a moving average or VWAP — to confirm what price action is already showing.
What Timeframe Should I Use for Index Analysis?
For day trading the S&P 500 or Nasdaq 100 futures, the daily sets the context, the one-hour and fifteen-minute define the bias, and the five-minute drives entries. Swing traders rely mostly on the daily and weekly charts. Investors looking to time entries use weekly and monthly structure.
How Do You Find Key Levels on Indices?
Use the chart’s history. Mark obvious swing highs and lows, prior day and prior week extremes, all-time highs, and round numbers. Add the cash session opening price and the daily VWAP. Levels that price has tested multiple times carry more weight than levels it has only touched once.
Can Beginners Use Price Action on Stock Indices?
Yes. Start with one index — most beginners pick the S&P 500 — and one timeframe, usually the daily. Mark the higher highs and higher lows. Note where the index has reversed. After a few weeks, the levels that matter will be obvious and the rest will be noise.
How Does the VIX Affect Price Action on Indices?
The VIX measures expected volatility and tends to rise when indices fall. A rising VIX with falling prices confirms a risk-off regime. A falling VIX during a pullback often means the move is buyable. A spike in the VIX above its short-term moving average is a warning that trend days, gaps, and false breaks are more likely.
Conclusion
The single most important lesson in stock indices price action analysis is that the chart already knows what the next session is likely to do — long before the news cycle explains it. Structure, levels, and the behavior of the opening range tell most of what matters. The job is to read those signals, plan around the obvious levels, and only take trades that match the higher-timeframe context.
A practical next step: tonight, before the next session opens, pull up the daily chart of the S&P 500 and mark the prior five sessions’ highs and lows. Then open the four-hour chart and add the current week’s range. Write down two conditions under which a long entry would be taken and two under which a short entry would be taken. That small exercise, repeated before every session, builds the muscle faster than any indicator stack.
Trading carries risk. No method — price action, fundamental, or otherwise — removes the possibility of loss. Position size should reflect the volatility of the session ahead, stops should respect the structure, and the next trade should never depend on the last one. Read the chart, plan the trade, manage the risk, and let the index tell you what it wants to do.
—
This article is for educational purposes only and does not constitute investment advice. Trading and investing carry risk of loss; never invest more than you can afford to lose.
Last reviewed: August 2026