


















































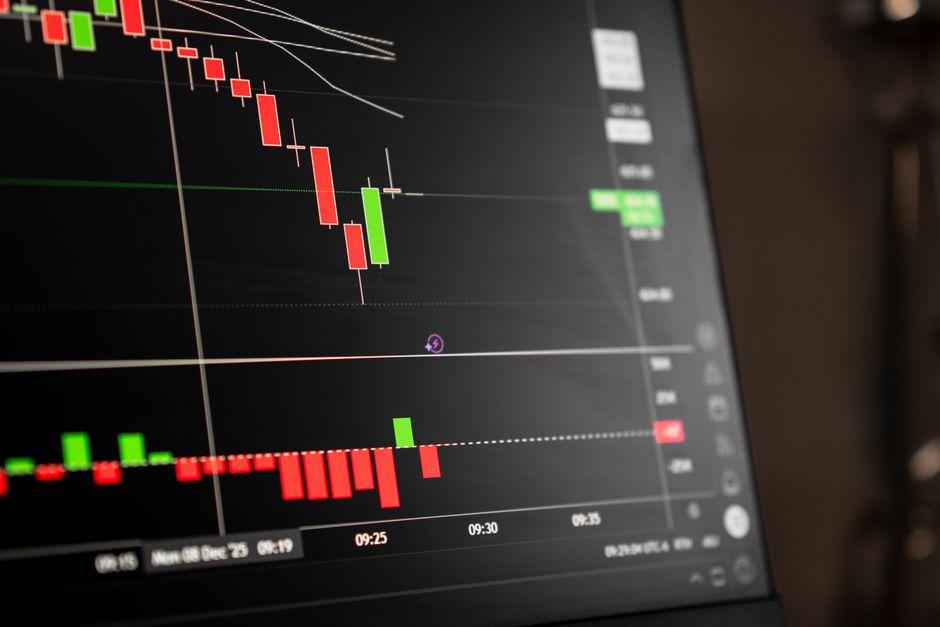
Price Action with Order Blocks: Advanced ICT Concepts

Table of Contents
- Introduction
- What Is Price Action with Order Blocks?
- Why Order Blocks Matter for Traders and Investors
- Core Concepts
- Step-by-Step Guide to Trading Order Blocks
- Practical Tips for Better Results
- Common Mistakes to Avoid
- Frequently Asked Questions
- Conclusion
Introduction
Consider a scenario where the S&P 500 trends aggressively lower over a three-day window. Retail traders, reacting to a perceived strong downtrend, continue to sell into the move, adding to their short positions. Suddenly, price hits a precise level, reverses with violent momentum, and leaves a massive gap in the candle sequence. While the average retail trader labels this a simple bounce, institutional analysts recognize it as a concentrated injection of capital. This is a deliberate move designed to trap sellers and shift the market regime.
The fundamental problem for most retail participants is a reliance on lagging indicators or static support and resistance lines. These tools often fail because they ignore the reality of where large institutions—central banks, hedge funds, and Tier-1 banks—actually execute their orders. By the time a standard moving average or RSI signals a trend change, the institutional smart money has already established its position and is now seeking the liquidity necessary to exit or scale.
Understanding price action with order blocks allows a trader to stop guessing and start tracking the actual footprint of institutional order flow. This methodology focuses on identifying specific zones where major players have left unfilled orders. This guide explains how to identify these zones, differentiate between genuine structural shifts and mere pullbacks, and execute trades with a professional risk-reward profile.
What Is Price Action with Order Blocks?
Price action with order blocks is a sophisticated methodology used to identify specific candles where institutional players entered the market with significant volume. Unlike a standard support level, which is often a broad and vague area of interest, an order block is the precise candle that initiated a strong, impulsive move capable of breaking the previous market structure.
In a bullish scenario, a Bullish Order Block is defined as the last down-close candle, or a tight series of candles, before a strong move higher that creates a new swing high. The underlying theory is that institutions may have sold initially to induce retail buyers to go short or to clear out liquidity before launching their actual buy program. When price eventually returns to this specific candle, it frequently finds strong support. This occurs because institutions are mitigating their remaining sell positions or adding to their long exposure at a wholesale price.
Why Order Blocks Matter for Traders and Investors
The majority of retail trading strategies fail because they ignore the concept of liquidity. Markets do not move because of a crossover on a moving average; they move to seek liquidity—specific price levels where a large cluster of stop-loss orders resides. Order blocks serve as the markers of where that liquidity was captured and where the trend was fundamentally shifted by high-volume participants.
For an active trader, this distinction is the difference between entering a trade at a random support line and entering at a high-probability Point of Interest (POI). When you align an order block with a higher-timeframe trend, you effectively reduce your drawdowns and increase the probability of a rapid move in your favor. Ignoring these mechanics often means the retail trader becomes the very liquidity that institutions use to fill their own massive orders.
Institutional investors use these zones to manage slippage and minimize the market impact of their trades. By understanding these mechanics, a retail trader can essentially piggyback on the movements of the largest players in the global market, whether it is the Federal Reserve’s influence on Treasury yields or the massive capital flows within the Forex majors.
Change of Character (ChoCH) vs. Break of Structure (BOS)
Distinguishing between a Break of Structure (BOS) and a Change of Character (ChoCH) is the foundation of professional market structure analysis. A Break of Structure occurs when the price continues in the direction of the established trend. For instance, in an uptrend, the price makes a higher high, pulls back, and then breaks that high again. This confirms that the current trend remains intact and the momentum is still bullish.
A Change of Character, however, is a signal that the trend may be reversing. This happens when the price fails to reach a new high and instead crashes through the previous swing low. This shift indicates that the institutional order flow has flipped from bullish to bearish.
Scenario: Consider the EUR/USD on a 15-minute chart. Price has been consistently making higher highs (BOS) for several hours. Suddenly, the price sweeps a previous high and then drops aggressively, closing below the most recent swing low. This is a ChoCH. It signals to the trader that the bullish momentum has evaporated and it is now time to search for a bearish order block to initiate a short position.
Fair Value Gaps (FVG) and Imbalance
A Fair Value Gap occurs when a candle is so impulsive that it leaves a void in the price action. This happens when there is a severe imbalance between buyers and sellers, causing the price to move too quickly for all orders to be filled. On a chart, this appears as a gap between the wick of the first candle and the wick of the third candle in a three-candle sequence.
Institutions often view FVGs as magnets. Price has a natural tendency to return to these gaps to rebalance the market before continuing the primary trend. This is a function of market efficiency; the market seeks to fill these voids to ensure a smooth distribution of price.
Scenario: During a bullish expansion on the Nasdaq (NQ), a massive green candle shoots upward. The wick of the candle preceding it and the wick of the candle following it do not overlap, leaving a clear void. This is your FVG. If you observe the price returning to this gap and tapping into a nearby order block, you have a high-confluence entry. The FVG acts as the bridge that draws the price back to the order block for a secondary injection of capital.
Mitigation and the Return to Order Block
Mitigation is the process by which an institution closes a losing position at break-even or a small profit before the market moves in the intended direction. When an institution creates a bullish order block, they often have some sell positions open to manipulate the price or facilitate the move. They must return to that zone to mitigate those sells before the price can truly expand higher.
This is why professional traders do not enter a trade the moment a break of structure occurs. Chasing the price after a breakout means buying at a premium. Instead, the disciplined approach is to wait for the return to the order block.
Scenario: Price breaks a major resistance level on the 4-hour chart of Bitcoin. Instead of buying the breakout, you identify the last bearish candle that started the move. You wait for the price to drift back down into that candle’s range. This return is the mitigation phase. Once the price touches the order block and shows a bullish reaction on a lower timeframe, such as the 5-minute chart, you enter. This ensures you are buying at a discount rather than chasing a peak.
Step 1: Identify the Higher Timeframe (HTF) Bias
Order blocks cannot be traded in isolation. The first step is to determine the overall direction on a daily or 4-hour chart. If the daily trend is bullish, you should exclusively look for bullish order blocks on lower timeframes. Trading against the HTF bias significantly increases the risk of being stopped out by a larger institutional move.
Check for the most recent liquidity sweep. Did the price take out a previous day’s high or low? Institutions often sweep these levels to gather the necessary orders before reversing the price in the opposite direction.
Step 2: Locate the Order Block and FVG
Once the bias is established, look for a strong, impulsive move that broke a previous structure (BOS). Identify the specific candle that initiated that move.
For a long trade: Locate the last down-close candle before the impulsive move upward.
For a short trade: Locate the last up-close candle before the impulsive move downward.
Ensure there is a Fair Value Gap (FVG) immediately following the order block. A block without an FVG is generally considered a lower-probability institutional zone, as the lack of imbalance suggests the move was not driven by significant institutional capital.
Step 3: Wait for the Lower Timeframe (LTF) Confirmation
Avoid the temptation to simply set a limit order at the block and hope for a reaction. Wait for the price to enter the zone, and then look for a Market Structure Shift (MSS) on a lower timeframe. For example, if your order block is identified on the 1-hour chart, look for confirmation on the 5-minute or 1-minute chart.
The professional confirmation sequence should be:
1. Price enters the HTF Order Block.
2. Price creates a ChoCH or MSS on the LTF.
3. Price returns to a small LTF order block or FVG.
4. Enter the trade.
Step 4: Define Risk and Exit Parameters
Set your stop-loss slightly below the bottom of the bullish order block or above the top of the bearish block. If the price closes beyond the block, the institutional thesis is invalidated, and the position must be closed.
For targets, look for external liquidity, which consists of the opposite swing highs or lows. While a 1:2 or 1:3 risk-reward ratio is common, institutional traders often target the buy-side or sell-side liquidity pools where retail stop-losses are likely clustered.
Practical Tips for Better Results
Prioritize Clean Blocks: The most reliable order blocks are those that result in a violent, impulsive move away from the zone. If the price slowly drifts away, the block is likely weak and lacks institutional backing.
Use Premium and Discount Zones: Only look for bullish order blocks in the discount zone, which is the bottom 50% of the current trading range. Conversely, look for bearish blocks in the premium zone, the top 50%. Buying in a premium or selling in a discount is a fundamental error in valuation.
Combine with Killzones: Institutional activity peaks during specific windows of time. Focus on the London Open and the New York Open. Order blocks formed or tapped during these killzones have a significantly higher success rate due to the surge in volume.
Watch for SMT Divergence: If the S&P 500 makes a new high but the Nasdaq fails to do so, this is Smart Money Tool (SMT) divergence. It signals that one of the assets is lying, and a reversal is likely imminent. This is a powerful confirmation tool for identifying institutional distribution.
Avoid News Spikes: High-impact news from the Non-Farm Payrolls (NFP) or the Federal Reserve can blow through any technical zone. Wait for the news volatility to settle and for a new structure to form before entering a position.
Focus on One Pair: Price action is a skill rooted in pattern recognition. Trading only one or two instruments, such as EUR/USD or Gold, helps you recognize the specific personality and liquidity patterns of that market.
Common Mistakes to Avoid
Trading Every Block: Not every candle is an order block. If the move did not break a structure or leave an FVG, it is simply a candle. Trading every perceived block leads to overtrading and significant drawdowns.
Ignoring the Trend: Attempting to find a bullish order block in a crashing market is a recipe for failure. Always align your entries with the higher-timeframe flow to ensure you are trading with the wind at your back.
Setting Stops Too Tight: While order blocks provide precision, market volatility can cause wicks that hunt for liquidity just beyond the block. Give your trade a few pips of breathing room to avoid being stopped out by noise.
Chasing the Move: Entering a trade after the price has already left the order block and moved halfway to the target ruins your risk-reward ratio and increases the likelihood of entering at a local top.
Confusing Support/Resistance with Order Blocks: A support line is a price level; an order block is a zone of institutional activity. If the price reaches a support line but there is no corresponding order block or FVG, the probability of a reversal is significantly lower.
How do I identify a valid order block?
A valid order block must be the candle that initiated a move strong enough to break a previous market structure (BOS). It must be accompanied by displacement—a fast, aggressive move—and ideally leave a Fair Value Gap (FVG) behind. If the price simply moves sideways after the candle, it does not qualify as a valid order block.
What is the difference between a supply zone and an order block?
A supply zone is a general area where sell orders are concentrated, often identified by a rally-base-drop pattern. An order block is more specific; it is the exact candle that caused the drop. While supply zones are broader, order blocks are used for higher precision entries and are rooted in the mechanics of institutional order flow.
Why do order blocks fail during high-impact news?
During high-impact news, volatility spikes and liquidity vanishes. Large institutions may move their orders or execute them in ways that ignore previous structural zones. The sheer volume of orders during a Federal Reserve announcement can blow through any technical level, making a wait-and-see approach the only safe strategy.
When is the best time of day to trade ICT concepts?
The most reliable moves occur during the London and New York sessions. Specifically, the London Killzone and the New York Killzone are when the most institutional volume enters the market, creating the clear displacements and order blocks that this strategy relies on.
Can order blocks be used on 1-minute charts?
Yes, but they must be used in conjunction with higher timeframes. A 1-minute order block is only high-probability if it occurs within a 15-minute or 1-hour order block. Trading the 1-minute chart in isolation is essentially gambling on market noise.
Is price action trading better than using indicators?
Price action is a leading indicator because it tracks the actual movement of money. Indicators like the RSI or MACD are lagging, meaning they describe what happened in the past. By focusing on order blocks and liquidity, you are analyzing the cause of the move rather than the effect.
Conclusion
The core lesson of price action with order blocks is that the market is not random; it is a mechanism for moving liquidity. By identifying where institutions have left their footprints—through order blocks, FVGs, and market structure shifts—you stop fighting the trend and start following the money.
Your next step should be to open a chart of a major currency pair or index and review the last three major moves. Identify the candle that started the move, check for an accompanying Fair Value Gap, and observe if the price returned to that zone before continuing its trajectory.
Trading involves significant risk of loss. No strategy, including ICT concepts, can guarantee a 100% win rate. Always use a stop-loss, manage your position sizing based on your account equity, and never risk more than 1-2% of your capital on a single trade.
*
Disclaimer: Trading financial instruments carries a high level of risk and may not be suitable for all investors. The information provided in this article is for educational purposes only and does not constitute financial advice. Past performance is not indicative of future results.
—
This article is for educational purposes only and does not constitute investment advice. Trading and investing carry risk of loss; never invest more than you can afford to lose.
Last reviewed: August 2026


