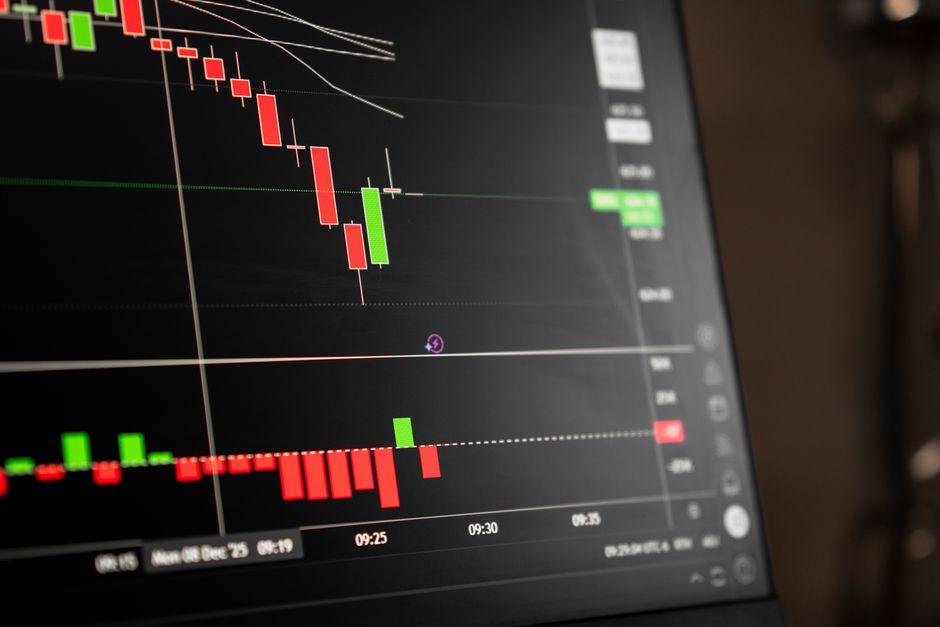
Price Action for Scalping: Reading 1m and 5m Charts

Table of Contents
- Introduction
- What Is Price Action?
- Why Price Action Matters for Traders and Investors
- Core Concepts
- Step-by-Step Guide
- Practical Tips for Better Results
- Common Mistakes to Avoid
- Frequently Asked Questions
- Conclusion
Introduction
Price action scalping sits at the center of professional short-term trading, and mastering it fundamentally changes how a trader interacts with the tape.
Consider the New York open for the NASDAQ (NAS100). Within seconds, the price spikes 20 points, reverses sharply, and then consolidates into a tight range. A trader relying on a 14-period RSI or a lagging Moving Average will likely see a sell signal just as the price hits a major institutional buy zone. By the time the indicator confirms the trend, the move is over and the profit window has closed. This is the primary struggle for scalpers: the inherent lag between a mathematical signal and the actual market move.
In high-frequency environments, indicators are merely derivatives of price. They describe what has already happened, not what is happening in real-time. To survive on the 1-minute (1m) and 5-minute (5m) charts, you must read the raw movement of the tape. This requires a shift in perspective from searching for textbook patterns to understanding the flow of liquidity and the intent of institutional participants.
This guide provides a high-precision framework for identifying micro-reversals and trend continuations. You will learn how to isolate order blocks, identify liquidity voids, and execute trades based on market structure shifts without the noise of lagging indicators.
What Is Price Action?
Price action is the study of the raw movement of an asset’s price over time, stripped of all lagging indicators. It operates on the premise that all fundamental news, psychological sentiment, and institutional orders are already baked into the current price. Instead of asking what a MACD crossover means, a price action trader asks why the price reacted at a specific level and who was forced to liquidate their position to make that move happen.
For example, consider a scenario where the EUR/USD has been trending downward. Suddenly, the price dips below a visible support level, triggers a cluster of sell-stop orders, and immediately snaps back upward with a large bullish candle. This is not a random bounce; it is a liquidity sweep. The price action reveals that institutional players used the retail stop-losses to fill their own large buy orders without moving the market too far against themselves.
Why Price Action Matters for Traders and Investors
Scalping is the process of capturing small price movements over very short durations. On a 1m chart, a few pips or ticks can represent a significant percentage of the trade’s goal. When your timeframe is this tight, the bid-ask spread and execution speed become critical factors. Indicators often smooth out data, which effectively removes the very volatility a scalper needs to find an edge.
Institutional traders, such as those at hedge funds or prime brokerages, do not use retail indicators to enter positions. They seek liquidity—areas where there are enough opposite orders to fill their massive positions without causing excessive slippage. By learning price action, a retail trader aligns themselves with this institutional flow rather than fighting against it.
If you ignore price action and rely solely on indicators, you are essentially trading a ghost of the past. You will often find yourself entering trades at the exact moment the smart money is exiting, leading to the classic experience of being right about the general direction but wrong about the specific timing.
Order Block Identification and Mitigation
An order block is a specific candle or cluster of candles where institutional players have placed significant buy or sell orders. These are not merely support and resistance lines; they are zones of high-volume interest. When price returns to these zones, it often reacts sharply because the remaining unfilled orders are triggered.
In a bullish scenario, an order block is often the last down-close candle before a strong impulsive move higher. For example, if the S&P 500 drops sharply and then rallies 30 points in five minutes, the candle that started that rally is your order block. When the price eventually drifts back down to that specific candle’s range, you look for a reaction to go long. This process of returning to the block to trigger remaining orders is called mitigation.
Fair Value Gaps (FVG) and Liquidity Voids
A Fair Value Gap occurs when price moves so rapidly in one direction that it leaves a hole in the price action, creating an imbalance. This happens when there is a massive surplus of buyers or sellers and not enough opposite orders to support a smooth transition. These gaps act like magnets; the market has a historical tendency to return to these areas to fill the void and balance the price.
Consider a 1m chart of Bitcoin where a massive green candle shoots up, leaving a gap between the high of the first candle and the low of the third candle. This gap is an FVG. A professional scalper does not buy at the top of that spike. Instead, they wait for the price to retrace into that gap. Once the price enters the FVG and shows a sign of rejection, it provides a high-probability entry for a continuation trade.
Candlestick Psychology: Pin Bars and Engulfing Patterns
While many treat candlesticks as static shapes, a professional analyst views them as a battle between buyers and sellers. A Pin Bar, for example, is not just a reversal signal; it is a visual representation of a failed attempt to push price lower. It shows that the market tested a level, found aggressive buyers, and rejected the lower prices rapidly.
An engulfing pattern is even more aggressive. If a small red candle is followed by a massive green candle that completely covers the previous candle’s range, it signals a total shift in control. For example, on a 5m chart of the USD/JPY, a bullish engulfing candle appearing at a known order block suggests that the bears have been overwhelmed and a short-term trend reversal is imminent.
Market Structure Shifts (MSS) and Break of Structure (BOS)
Market structure is the foundation of all price action. A trend is simply a series of higher highs and higher lows in a bullish market, or lower highs and lower lows in a bearish market. A Break of Structure (BOS) occurs when the price continues the current trend by breaking a previous high or low. This confirms that the current trend is still intact and the momentum is sustained.
A Market Structure Shift (MSS), however, is a change in character. This happens when the price fails to make a new high and instead breaks the previous higher low. For example, if the NASDAQ is climbing and then suddenly crashes through the last swing low on the 1m chart, the structure has shifted from bullish to bearish. This is the signal to stop looking for buy setups and start searching for short-term sell opportunities.
Step 1 — Define the Higher Timeframe Bias
You cannot scalp in a vacuum. Before touching the 1m chart, look at the 15m or 1h chart to determine the overall direction. If the 1h trend is strongly bullish, you should prioritize long setups on the 1m chart. Trading against the higher timeframe bias increases your risk of being caught in a stop run, where the market briefly reverses before continuing its primary move.
Identify the major order blocks and FVGs on the 15m chart. These are your zones of interest. Your goal is to wait for the price to enter one of these zones before dropping down to the 1m chart for a precise entry. This top-down approach ensures you are trading with the wind at your back.
Step 2 — Identify the Liquidity Sweep
Once the price enters your zone of interest, look for a liquidity sweep. This is often a fake-out where the price breaks a previous minor high or low to trigger stop-losses. In a bullish setup, you want to see the price dip below a recent 1m low, trapping breakout sellers and hitting the stops of early buyers.
This sweep is the engine that provides the liquidity necessary for a large institutional move. If the price simply touches a level and bounces, it is a standard trade. If it sweeps a low and then violently reverses, it is a high-probability setup because the market has cleared out the opposing side.
Step 3 — Confirm the Market Structure Shift (MSS)
Do not enter the trade immediately after the sweep. Wait for the Market Structure Shift. If you are looking for a long, wait for the price to create a higher high on the 1m chart, breaking the most recent swing high. This confirms that the buyers have actually taken control and the reversal is not just a temporary flicker in a downtrend.
The moment the MSS occurs, look for a newly created Fair Value Gap or a small order block left behind by the shift. This is your entry point. Entering here allows you to align your trade with the new momentum while keeping your risk tightly defined.
Step 4 — Set Precision Stops and Targets
In scalping, your stop-loss must be tight, but not suffocating. Place your stop slightly below the low of the liquidity sweep. If the price returns to that level, your thesis is invalidated, and you must exit the position immediately.
For targets, look for the opposite liquidity. If you went long after a sweep of the lows, your target should be the nearest cluster of buy-stops, such as previous highs, or an unfilled FVG above the current price. A common scalping target is a 1:2 or 1:3 risk-to-reward ratio. Because you are operating on a 1m chart, these targets are often hit within minutes, allowing for a fast turnover of capital.
Practical Tips for Better Results
- Focus on high-volatility windows. The best price action occurs during the London and New York sessions. Trading the Asian session often results in choppy price action that lacks the momentum required for successful scalping.
- Watch the spread. On a 1m chart, a 2-pip spread on a currency pair can eat 20% of your profit. Only scalp instruments with tight spreads and high liquidity, such as EUR/USD or the S&P 500 E-mini futures.
- Use a one and done rule for specific setups. If you take a trade based on a liquidity sweep and it hits your stop, do not immediately jump back in. The market may be in a different regime, and over-trading is the fastest way to deplete a small account.
- Correlation check. If you are scalping the NASDAQ, keep an eye on the S&P 500 and the 10-year Treasury yield. If the NASDAQ is showing a bullish MSS but the S&P 500 is still crashing, the move may be a fake-out.
- Prioritize clean charts. Avoid adding five different indicators. The only things on your screen should be the price candles, a few marked zones of interest, and perhaps a volume profile to see where the most contracts have changed hands.
- Record every trade with a screenshot. Price action is a skill of pattern recognition. By reviewing your missed trades, you will start to notice the subtle difference between a genuine MSS and a mere pause in a downtrend.
Common Mistakes to Avoid
- Trading in the middle of a range. Many scalpers try to pick tops and bottoms in a sideways market. This leads to death by a thousand cuts as you get stopped out by minor fluctuations. Only trade when price is at a clear boundary or breaking out of one.
- Ignoring the news calendar. A high-impact event, such as a Federal Reserve interest rate decision or a Non-Farm Payroll (NFP) report, renders technical price action irrelevant for a few minutes. The volatility is too high, and slippage can make your stop-loss meaningless.
- Chasing the candle. Seeing a massive green candle and buying at the top is a recipe for disaster. Professional scalpers buy the dip into the FVG or the order block. If you missed the entry, let the trade go.
- Over-leveraging small accounts. Because scalping involves many trades, the temptation to use high leverage is strong. One unexpected spike against your position can lead to a margin call. Always size your positions based on a fixed percentage of your equity, such as 0.5% to 1% per trade.
How do I find the best price action patterns for scalping?
Focus on the interaction between liquidity and structure. Look for stop runs where price aggressively takes out a previous high or low and then immediately reverses. These are more reliable than standard chart patterns like head-and-shoulders, which often fail on 1m timeframes due to the noise of high-frequency trading.
What is the best time frame for price action scalping?
The 5-minute chart is ideal for establishing the immediate trend and identifying zones of interest. The 1-minute chart is then used for the actual entry to refine the stop-loss and maximize the risk-to-reward ratio. This combination allows you to see the big picture while executing with surgical precision.
Why is price action better than indicators for 1-minute charts?
Indicators use past data to calculate a value, creating a lag. In a 1m environment, a lag of three candles can be the difference between a profitable trade and a loss. Price action is real-time and shows the immediate pressure of buyers and sellers, allowing you to react to the market as it happens.
When should I exit a scalp trade based on price action?
Exit when the price reaches a liquidity zone on the opposite side, such as a previous swing high or an unfilled FVG. Alternatively, exit if the price action shows a counter-MSS, meaning the trend you were trading has officially shifted in the opposite direction.
Can beginners learn price action scalping quickly?
The concepts are simple, but the execution is difficult. It requires hours of screen time to develop the eye for liquidity sweeps and order blocks. Beginners should start with a demo account to practice identifying these zones before risking real capital in a live market.
Is price action scalping risky for small accounts?
Yes, because of the high frequency of trades and the potential for over-leveraging. However, this risk can be managed by using strict position sizing and focusing on high-probability setups rather than trying to trade every single 1m candle.
Conclusion
The core of successful scalping is the ability to distinguish between a trend continuation and a liquidity trap. By focusing on order blocks, fair value gaps, and market structure shifts, you move away from guessing and toward analyzing the actual mechanics of the market. The most important lesson is that price is the only leading indicator; everything else is a lagging confirmation.
Your next step should be to open a 5-minute chart of a high-liquidity asset like the S&P 500 and mark every obvious Fair Value Gap from the last 48 hours. Observe how often the price returns to those gaps before continuing its move. This exercise will train your brain to see the imbalances that institutional traders exploit.
Trading involves significant risk of loss. Scalping, in particular, requires fast decision-making and strict discipline. Never trade money you cannot afford to lose, and always use a stop-loss to protect your capital. There are no guaranteed returns in the financial markets, and risk management is the only way to ensure long-term survival.
*
Disclaimer: Trading involves risk. The analysis provided is for educational purposes and does not constitute financial advice. Past performance is not indicative of future results.
—
This article is for educational purposes only and does not constitute investment advice. Trading and investing carry risk of loss; never invest more than you can afford to lose.
Last reviewed: August 2026