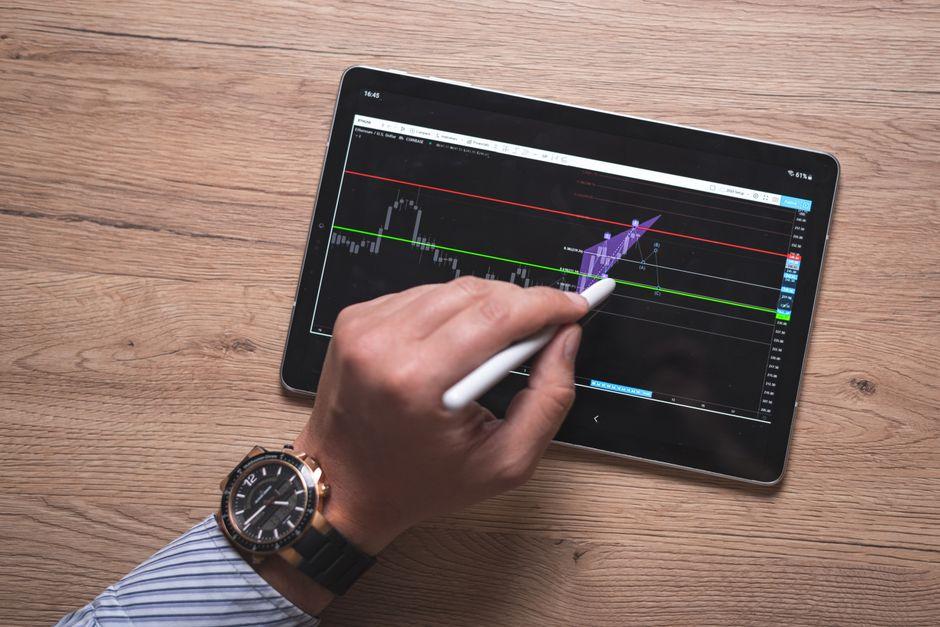
Market Analysis with Wyckoff: Accumulation and Distribution

Table of Contents
- Introduction
- What Is the Wyckoff Method?
- Why Wyckoff Matters for Traders and Investors
- Core Concepts
- Step-by-Step Guide to Wyckoff Analysis
- Practical Tips for Better Results
- Common Mistakes to Avoid
- Frequently Asked Questions
- Conclusion
Introduction
Imagine a blue-chip equity that has plummeted 30% over a six-month window. Retail traders, gripped by panic and momentum-driven fear, continue to sell into every minor relief bounce. Suddenly, the price action shifts. It stops carving out new lows and begins to oscillate within a tight, sideways range. While the headlines remain overwhelmingly bearish, a divergence emerges: volume spikes on down-days, yet the price barely budges. This is not a random fluctuation; it is the visible footprint of institutional capital absorbing available supply.
The fundamental struggle for the retail trader is that they react to price, whereas institutional players create price. By the time a trend reversal becomes obvious via a lagging indicator or a standard moving average crossover, the most lucrative entry point has usually vanished. Professional market analysis requires a paradigm shift from following indicators to understanding the raw mechanics of supply and demand.
The Wyckoff Method provides a rigorous, structured framework to identify these institutional phases. By analyzing the precise relationship between price and volume, a trader can distinguish between a temporary pause in a downtrend and a genuine structural reversal. This guide details how to identify accumulation and distribution cycles, allowing you to align your portfolio with the smart money rather than fighting against it.
What Is the Wyckoff Method?
The Wyckoff Method is a sophisticated school of technical analysis predicated on the belief that the market is steered by a small group of large players—institutional investors, hedge funds, and central banks. These entities move such massive blocks of capital that their activities leave indelible patterns in price and volume data. Rather than relying on oscillators that often provide contradictory signals in trending markets, Wyckoff treats the market as a series of logical cycles: accumulation, mark-up, distribution, and mark-down.
To visualize this, consider a large mutual fund intending to build a massive position in an S&P 500 component. If the fund were to execute a single market order for millions of shares, they would spike the price upward, ruining their own average cost basis. Instead, they employ a strategy of gradual absorption. They buy slowly over weeks or months, creating a sideways range where they soak up all available sell orders from exhausted retail traders. This process of stealthy acquisition is the essence of accumulation.
Why Wyckoff Matters for Traders and Investors
A significant portion of retail traders fail because they inadvertently trade against the prevailing institutional flow. They buy the dip during a distribution phase, thinking they are getting a bargain, or sell a breakout during an accumulation phase, fearing a new low. Wyckoff analysis allows a trader to stop guessing and start observing the actual transfer of ownership from weak hands to strong hands.
Ignoring these cycles exposes a trader to the risk of entering a position exactly when the smart money is exiting. During a parabolic cryptocurrency rally, for instance, retail euphoria typically peaks just as institutions are executing a distribution strategy. Without a framework to identify the Upthrust After Distribution (UTAD), a trader may buy the absolute top, unaware that the liquidity they are providing is being used by professionals to liquidate their positions.
For the long-term investor, this methodology is invaluable for identifying the floor of a bear market. By recognizing the transition from a Selling Climax to a Spring, an investor can build a core position with a defined risk level and a clear invalidation point, rather than blindly averaging down into a falling asset and risking a total drawdown.
The Law of Supply and Demand
At its most basic level, price movement is the result of an imbalance between the available supply of an asset and the demand for it. When demand exceeds supply, prices rise. When supply exceeds demand, prices fall. The professional edge comes from observing how price reacts to specific volume levels.
Consider a stock hitting a historical support level. If the price touches that level on massive volume but fails to close lower, it indicates that demand is absorbing the supply. The selling pressure is being met by aggressive buying interest. In the context of market cycles, this absorption often serves as the precursor to a trend reversal.
The Law of Cause and Effect
In the Wyckoff framework, a significant move in price (the effect) cannot happen without a prior period of preparation (the cause). The cause is the sideways range—the accumulation or distribution phase. The longer an asset spends in this range, the more potent the eventual breakout tends to be.
Take a Nasdaq-100 stock that trades within a narrow 10% range for four months. This period of consolidation represents the cause. If the stock eventually breaks out of this range, the magnitude of the resulting move is often proportional to the time spent consolidating. A three-day consolidation rarely leads to a 50% rally, whereas a four-month consolidation often provides the necessary fuel for such a move.
Composite Man Theory
Wyckoff suggests a mental model where all market participants are viewed as a single entity: the Composite Man. This represents the collective institutional force moving the market. The goal of the analyst is to reverse-engineer the actions of the Composite Man.
If the Composite Man intends to accumulate, he will first drive the price down to trigger stop-losses and induce panic, creating a Selling Climax. Once the retail crowd is exhausted and the selling pressure peaks, he absorbs the shares. When you observe a sudden price drop followed by a rapid recovery and low-volume testing, you are witnessing the Composite Man clearing the board of sellers to prepare for a mark-up.
Springs and Upthrusts
A Spring is a false breakdown. Price dips below a support level to trap breakout sellers and trigger stop-losses, only to quickly reverse and climb back into the range. This is the ultimate signal that supply has been exhausted and the path of least resistance is now upward.
An Upthrust is the mirror image. In a distribution phase, the price spikes above a resistance level, tricking buyers into believing a new rally has begun. Once the buyers are trapped at the top, the price collapses back into the range. In a crypto rally, an Upthrust After Distribution (UTAD) often marks the absolute peak before a severe drawdown.
Preliminary Support (PS) and Selling Climax (SC)
Before a full accumulation range is established, there is typically a Preliminary Support (PS) phase where the initial panic selling begins to slow. This is followed by the Selling Climax (SC), a violent move lower characterized by extreme volume and wide price spreads. This represents the final capitulation of the bears.
In a blue-chip stock crash, the SC is the moment when the worst-case scenario hits the news cycle and everyone sells simultaneously. The resulting massive volume spike, without a corresponding further drop in price, suggests that institutional buyers have stepped in to provide the necessary liquidity to stop the bleed.
Step-by-Step Guide to Wyckoff Analysis
Step 1: Identify the Current Trend and Phase
Before applying Wyckoff schematics, you must determine the overarching trend using a daily or weekly chart. The primary question is: Is the asset in a mark-up phase (uptrend), a mark-down phase (downtrend), or is it moving sideways?
If the asset has been in a prolonged decline and is now moving sideways, you are looking for an Accumulation Schematic. If it has been rallying and is now stalling, you are looking for Distribution. It is a common mistake to try and find accumulation during a parabolic move; you must wait for the price to enter a clear trading range.
Step 2: Map the Trading Range
The next step is to define the boundaries of the range. Mark the highest point of the Selling Climax (the top of the range) and the lowest point of the SC or the subsequent Spring (the bottom of the range).
Watch for the Automatic Rally (AR), which is the first significant bounce after the Selling Climax. This rally defines the upper boundary of the accumulation zone. Any price action between the SC and the AR is your primary area of interest. At this stage, you are observing the battle between the remaining retail sellers and the accumulating institutions.
Step 3: Look for the Test and the Spring
Do not enter a trade simply because a range has formed. Wait for the price to return to the bottom of the range. A Test occurs when the price dips toward the support level on decreasing volume, proving that there are no more sellers left to push the price lower. A Spring is a more aggressive move where the price briefly breaks the support and then recovers rapidly.
The decision to enter is based on this behavior. If the price breaks the support and stays down, the accumulation has failed, and the trend remains bearish. If it breaks and snaps back, the trap has been sprung, and the market is primed for an upward move.
Step 4: Confirm with the Sign of Strength (SOS)
A Spring alone is not a buy signal; it is a warning that the bottom is near. The actual entry occurs during the Sign of Strength (SOS), where the price breaks out of the range with an increase in volume and a wide price spread.
Look for a Back-up or a Test of the breakout point. If the price breaks the range, pulls back slightly to the top of the range on low volume, and then resumes the climb, the move is confirmed. This is the optimal point to size your position, placing your stop-loss just below the most recent higher low to manage risk.
Practical Tips for Better Results
- Prioritize the Volume-Price relationship. If price is rising but volume is falling, the move lacks institutional backing and is likely a bull trap.
- Use higher timeframes to identify the Cause. A weekly accumulation range is far more reliable than a 15-minute range. Use the daily chart to time the Effect.
- Avoid trading in the middle of the range. The highest probability trades occur at the edges—specifically during the Spring or the UTAD.
- Monitor the VIX or other volatility indices. Accumulation often occurs during periods of high volatility that eventually compresses into a tight range.
- Combine Wyckoff with traditional support and resistance. A Wyckoff Spring that coincides with a multi-year horizontal support level is a high-conviction signal.
- Watch for Absorption. This occurs when price moves sideways into a resistance level with high volume but fails to break through. This indicates that institutions are selling into the buying pressure.
Common Mistakes to Avoid
- Entering too early. Many traders buy the Selling Climax (SC) thinking they have found the absolute bottom. The SC is where the most volatility occurs; wait for the Spring to confirm the floor.
- Ignoring volume. Price action without volume is noise. A breakout on low volume is often a fake-out and will likely return to the range.
- Over-analyzing small timeframes. Applying Wyckoff to 1-minute charts often leads to analysis paralysis because the noise of high-frequency trading (HFT) masks the institutional footprint.
- Confusing Re-accumulation with a new Accumulation phase. Re-accumulation happens during an existing uptrend. It is a pause for breath, not a bottom-fishing opportunity.
- Neglecting risk management. Even a perfect Wyckoff setup can fail if a black swan event hits. Always use a hard stop-loss based on the structure of the range, not a random percentage.
How do I identify a Wyckoff Spring?
A Spring is identified when the price drops below a well-established support level, creating a new low, but then quickly reverses and closes back inside the trading range. The key is the recovery; if the price stays below the support, it is a trend continuation, not a Spring.
What is the difference between accumulation and re-accumulation?
Accumulation occurs after a prolonged downtrend to start a new bullish cycle. Re-accumulation occurs during an existing uptrend when the price moves sideways to absorb profit-taking before continuing higher. The primary difference is the preceding trend.
Why does the Wyckoff method work in volatile markets?
Wyckoff focuses on the mechanics of liquidity. Volatile markets create the traps (Springs and Upthrusts) that institutions use to enter and exit large positions. By tracking these traps, you are essentially tracking the liquidity needs of the largest players.
When is the best time to enter a trade using Wyckoff?
The highest probability entry is during the Sign of Strength (SOS) or the Test after a breakout. Entering during the Spring is higher risk but offers a higher reward; entering on the SOS is a confirmation trade with a statistically better win rate.
Can Wyckoff analysis be used on 5-minute charts?
Yes, but with caution. The logic of supply and demand remains the same, but the Composite Man on a 5-minute chart is often an algorithm or a high-frequency trading firm rather than a long-term fund. The patterns are faster and more prone to noise.
Is Wyckoff better than standard technical analysis?
It is not necessarily better, but it is more fundamental. While indicators like the RSI or MACD tell you what has happened, Wyckoff explains why it happened by focusing on the cause (accumulation/distribution) and the effect (the trend).
Conclusion
The core lesson of the Wyckoff Method is that price is a byproduct of the struggle between supply and demand. By identifying the accumulation and distribution phases, you stop guessing where the market is going and start observing where the institutional capital is moving. The most critical step is the transition from the cause (the range) to the effect (the trend).
Your next practical step is to open a chart of a major index or a high-cap stock and look back at the last major trend reversal. Try to map the Selling Climax, the Automatic Rally, and the Spring. Seeing these patterns in hindsight is the only way to develop the intuition required to spot them in real-time.
Trading involves significant risk of loss. No method, including Wyckoff, can guarantee profits or predict future returns with absolute certainty. Always employ strict position sizing and risk management to protect your capital.
*
Disclaimer: Trading and investing in financial markets carry a high level of risk. The analysis provided here is for educational purposes and does not constitute financial advice. TradingIM and its contributors are not responsible for any financial losses incurred based on the use of this information.
—
This article is for educational purposes only and does not constitute investment advice. Trading and investing carry risk of loss; never invest more than you can afford to lose.
Last reviewed: August 2026