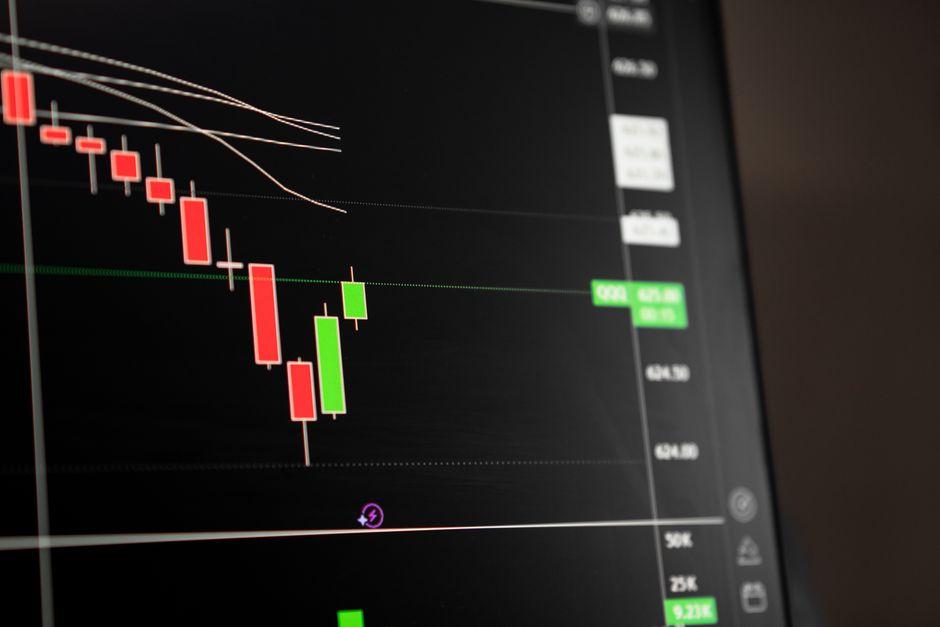
Market Analysis for Beginners: Support and Resistance

Table of Contents
- Introduction
- What Is Market Analysis?
- Why Support and Resistance Matter for Traders and Investors
- Core Concepts
- Step-by-Step Guide to Identifying Levels
- Practical Tips for Better Results
- Common Mistakes to Avoid
- Frequently Asked Questions
- Conclusion
Introduction
Consider a stock within the S&P 500 that has been trending lower for three consecutive weeks, yet consistently bounces back with precision every time it touches the $150 mark. To an inexperienced observer, this might appear to be a random occurrence. To a seasoned professional, this is a textbook signal of a support level. It is the exact point where buyers have stepped in to absorb selling pressure, preventing further decline. This is the fundamental objective of market analysis: identifying the invisible boundaries where the balance of supply and demand shifts.
The primary struggle for retail traders is the tendency to treat price movements as erratic or random. This often leads to a destructive cycle of chasing peaks during a climb and panic selling during a dip, resulting in entries and exits at the least advantageous prices. By failing to recognize these structural boundaries, traders ignore the footprints of institutional capital and the psychological triggers that drive the broader market.
Developing a proficiency in support and resistance allows a trader to move away from guesswork and toward a strategy based on empirical evidence. This guide details the methodology for locating these zones, validating them through volume analysis, and integrating them into a disciplined framework for risk management and position sizing.
What Is Market Analysis?
Market analysis is the systematic evaluation of financial data to forecast the probable direction of an asset’s price. While fundamental analysis focuses on the intrinsic value—examining earnings reports, Federal Reserve interest rate decisions, or GDP growth—technical market analysis prioritizes price action and volume. The underlying premise is that all known information is already baked into the current price; therefore, the price chart serves as the most transparent representation of market sentiment.
For instance, if a cryptocurrency asset fails to breach a historical peak of $60,000 on three separate occasions over a two-month window, market analysis suggests a heavy concentration of sell orders at that level. This resistance is not a physical barrier but a collective psychological agreement among participants that the asset is overvalued at that specific price point. When the volume of sell orders exceeds the appetite of buyers, the price is forced lower.
Why Support and Resistance Matter for Traders and Investors
Operating without an understanding of these levels is akin to navigating a city without knowing where the intersections are. Traders who ignore support and resistance frequently find themselves buying at the ceiling (resistance) or selling at the floor (support), which leads to immediate drawdowns and emotional trading.
Institutional traders and hedge funds do not execute their positions with a single click. Because they manage massive blocks of capital, they create liquidity zones. These zones are the birthplaces of support and resistance. By identifying these areas, you are essentially tracking the positioning of smart money.
For the long-term investor, these levels are indispensable for timing entries. Rather than purchasing a blue-chip stock at any available price, waiting for a return to a proven support level significantly improves the risk-to-reward ratio. For the day trader, these levels provide the precise coordinates for placing stop-loss orders, ensuring that a single trade does not result in a catastrophic loss of capital.
Psychological Round Numbers
Financial markets are driven by human behavior, and humans possess a natural bias toward round numbers. Price points such as $100, $1,000, or $50,000 often act as psychological barriers. Traders tend to cluster a disproportionate number of limit orders at these levels, creating a self-fulfilling prophecy of support or resistance.
Imagine a stock trading at $98. As it drifts toward $100, you will often observe a sudden surge in selling pressure. This occurs because a vast number of traders have set their take-profit orders at the round number of $100. This cluster of sell orders creates a resistance ceiling that requires a significant influx of buying volume to penetrate.
Role Reversal (Support Becoming Resistance)
A critical mechanism in price action is the principle of polarity. When a support level is decisively breached to the downside, it frequently flips and becomes a resistance level for subsequent price action. This shift occurs because traders who bought at the previous support are now sitting on losses. When the price eventually rallies back to that level, these traders sell to break even, creating a new wave of selling pressure.
Consider a stock that maintained a support floor at $50 for several months. A negative earnings surprise pushes the price down to $40. When the stock eventually recovers to $50, it often hits a ceiling and reverses. The former floor has become the new ceiling. Recognizing this reversal is essential for avoiding bull traps, where a price seems to be recovering only to fail at a previous support level.
Volume Confirmation at Key Levels
A price level is only as credible as the volume supporting it. If a price reaches a resistance level on low volume, it may indicate buyer exhaustion. Conversely, if the price breaks through that resistance accompanied by a massive spike in volume, it signals a genuine shift in market sentiment and the likely start of a new trend.
In a practical scenario, if a stock bounces off its 200-day moving average during a bullish cycle, the volume bars must be analyzed. A bounce supported by increasing buying volume validates the support. If the price merely drifts away from the moving average on thin volume, the support is fragile and prone to failure.
Step-by-Step Guide to Identifying Levels
Step 1 — Identify Major Swing Highs and Lows
The first step requires zooming out on the chart to gain a macro perspective. If you are analyzing a 15-minute chart for a trade, first switch to the daily or weekly view. Identify the most prominent peaks (swing highs) and valleys (swing lows). These represent your primary areas of interest.
The goal is to filter out the noise of minor price fluctuations and focus on the points where the price decisively changed direction. A level where the price has touched and reversed three times carries significantly more weight than a level touched only once.
Step 2 — Draw Zones, Not Lines
A frequent error among novices is drawing a thin, precise line at a specific price. In the actual market, support and resistance are zones. Market orders are typically spread across a range of prices due to slippage and varying trader preferences.
Instead of a single line at $100, draw a shaded box from $99.50 to $100.50. This provides a necessary buffer and prevents you from being stopped out by a minor price wick that momentarily pierces the line before the price reverses in your favor.
Step 3 — Validate with Secondary Indicators
Once the zones are established, use a secondary tool to confirm the level’s validity. This could be a moving average, such as the 50-day or 200-day EMA, or a Fibonacci retracement level.
When a manually drawn support zone aligns perfectly with the 200-day moving average, you have confluence. Confluence increases the probability that the level will hold, as both discretionary traders and algorithmic bots are reacting to the same data point.
Practical Tips for Better Results
- Use multiple timeframes to confirm levels. A support level identified on a weekly chart possesses far more structural strength than one found on a 5-minute chart.
- Watch for fakeouts. This occurs when the price briefly breaches a level to trigger stop-losses before reversing sharply. Wait for a candle to close outside the zone on a significant timeframe before assuming a break has occurred.
- Analyze the angle of approach. A price that drifts slowly into a support zone is more likely to bounce than a price that crashes into it with high downward momentum.
- Combine levels with candlestick patterns. A hammer or engulfing candle appearing exactly within a support zone is a high-probability buy signal.
- Monitor the VIX (Volatility Index). In high-volatility regimes, support and resistance zones tend to widen, and false breaks become more frequent.
- Prioritize recent levels. While a support level from five years ago provides historical context, a level formed last month is far more relevant to current liquidity and market participants.
Common Mistakes to Avoid
- Trading in the middle of a range. Entering a position halfway between support and resistance is a low-probability move. Without a clear edge, you have no logical place to set a stop-loss that isn’t easily hunted.
- Over-complicating the chart. Adding too many indicators can lead to analysis paralysis. When a trader sees five different support levels, they often become unable to execute a decision.
- Ignoring the overarching trend. Attempting to buy support in a powerful downtrend is often compared to catching a falling knife; the momentum frequently overrides the structural level.
- Setting stop-losses exactly on the line. High-frequency trading (HFT) algorithms often hunt for liquidity just below obvious support levels. Place your stop slightly below the zone to avoid being prematurely exited.
How do I find support and resistance levels?
Search for areas on the chart where the price has historically reversed. Identify the peaks and valleys across multiple timeframes and draw zones around these points. Use a combination of historical price action and volume to confirm whether the level is strong or weak.
What is the difference between static and dynamic support?
Static support consists of fixed price levels, such as a psychological round number or a historical low. Dynamic support moves as the price evolves, such as a 50-day moving average or a trendline, adjusting to the current trajectory of the asset.
Why do price levels break through resistance?
Resistance breaks when demand (buying pressure) significantly outweighs the supply (sell orders) at that level. This is often triggered by a fundamental catalyst, such as a positive earnings surprise or a shift in central bank policy, which attracts a new wave of buyers.
When is a support level considered broken?
A level is generally considered broken when a candle closes decisively below the support zone on a significant timeframe. A brief dip below the line, known as a wick, is often a fakeout. A full body close below the zone suggests the floor has collapsed.
Can moving averages act as support and resistance?
Yes, institutional traders frequently use the 50-day and 200-day moving averages as benchmarks. In a bullish trend, the price often dips to the 50-day MA, finds support, and bounces, effectively acting as a moving floor.
Is support and resistance reliable for day trading?
It is reliable, but the zones are much narrower and the noise is significantly higher. Day traders must combine these levels with short-term indicators like volume and order flow to avoid being trapped by intraday volatility.
Conclusion
The most vital lesson in market analysis is that price action is essentially a map of human emotion. Support and resistance levels are not magic, but they represent the points where the collective psychology of the market shifts from greed to fear, or vice versa. By identifying these zones, you transition from gambling on price movements to trading based on structural evidence.
A productive next step is to open a chart of a major index, such as the Nasdaq 100, and identify three major support and resistance zones on the daily timeframe. Observe how the price reacts when it touches these zones over the coming week to build your intuition.
Trading involves a significant risk of loss. No level of support or resistance provides a guaranteed return, and market conditions can shift instantly due to unforeseen macroeconomic news events. Always employ strict position sizing and stop-loss orders to protect your capital.
*
Disclaimer: Trading financial instruments carries a high level of risk and may not be suitable for all investors. The information provided in this article is for educational purposes only and does not constitute financial advice. TradingIM does not guarantee profits and is not responsible for any financial losses incurred.
—
This article is for educational purposes only and does not constitute investment advice. Trading and investing carry risk of loss; never invest more than you can afford to lose.
Last reviewed: August 2026