


















































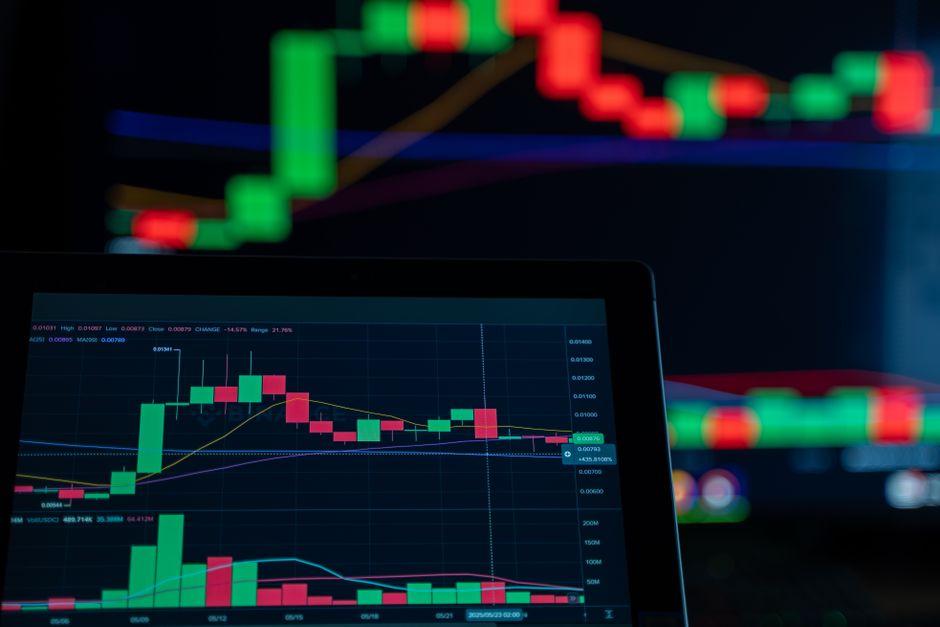
How to Master Candlestick Patterns Like a Pro Trader

Table of Contents
- Introduction
- What Does It Mean to Master Candlestick Patterns
- Why Candlestick Mastery Matters for Traders and Investors
- Core Concepts
- Step-by-Step Guide
- Practical Tips for Better Results
- Common Mistakes to Avoid
- Frequently Asked Questions
- Conclusion
Introduction
A trader stares at a S&P 500 futures chart and spots a textbook hammer sitting on a support level. The next session, the market gaps through that level and stops out the long. The pattern was technically correct. The context was wrong. No volume confirmation. No trend alignment. No higher-timeframe agreement. The trade failed for the same reason most candle-based trades fail: the shape was treated as a signal rather than a clue.
That gap between recognizing a pattern and trusting one is where most retail traders stall. Candlestick charts have been used in Japanese rice markets for centuries, and Western technical analysis adopted them in the 1990s after Steve Nison introduced the methodology to American trading desks. The shapes themselves are easy to learn in an afternoon. What separates a hobbyist from a professional is not memorization. It is the framework around the candle: where it forms, what volume confirms it, and whether higher timeframes agree with the story being told.
This article breaks down how to master candlestick patterns the way experienced swing traders and institutional desks do. You will get the core reversal mechanics, the volume and wick rules that filter false signals, and a step-by-step process for confirming setups across multiple timeframes. The goal is not to collect more shapes. It is to build a repeatable, evidence-based read of price that survives a drawdown.
What Does It Mean to Master Candlestick Patterns
Mastering candlestick patterns means moving past the visual dictionary of bullish, bearish, and neutral shapes and into the price-action logic each pattern represents. A candle is a compact record of four data points: open, high, low, and close over a defined period. The body shows the open-to-close range. The wicks, sometimes called shadows, show the extremes reached and rejected during the same period. That structure compresses an entire session of auction data into a single visual unit.
A pattern, then, is not the shape itself. It is the story of supply and demand imbalance the shape tells. A long lower wick on a bullish candle shows buyers stepping in after sellers pushed price down. A bearish engulfing candle shows sellers overwhelming buyers after a rally. The professional reads the story, then asks whether the surrounding market agrees with the ending. The candle is one data point. Context is what turns that data point into a trade.
A simple example: imagine a Nasdaq 100 daily chart that has been in a five-week downtrend. Price reaches a horizontal support level that has held twice before. A candle forms with a long lower wick, small body, and closes near its high. That single candle, taken alone, is a hammer. Taken in context, it is a potential reversal signal because the downtrend, the prior support test, and the wick rejection line up. Mastery is the difference between seeing the hammer and seeing the setup. The shape is the same. The probability of follow-through is dramatically different.
Why Candlestick Mastery Matters for Traders and Investors
Candlestick reading is the language of price action. Almost every chart-based strategy, from trend following to mean reversion, eventually depends on reading what candles are doing at key levels. A swing trader who cannot identify a bearish engulfing at resistance will misread momentum shifts. A day trader who ignores volume on a breakout candle will chase fakeouts. A position investor who watches weekly candles for a morning star reversal can time entries near multi-month lows with controlled risk.
The skill matters because markets spend most of their time in transition. Roughly 70% of price action consists of range-bound or corrective behavior, with clean trends making up the remaining minority. Candlestick patterns are how traders read those transitions in real time, catching the inflection points where a range breaks down or a trend exhausts. Without that skill, entries arrive late and exits miss the turn. The cost compounds through missed opportunity and increased drawdown.
Ignore the framework and three things go wrong. You enter on patterns that fail because context is missing. You size positions as if every pattern is equally trustworthy, blowing up on the false ones. You abandon the method after a losing streak because you cannot tell which signals deserved trust in the first place. Mastery is what keeps the method durable through rough patches and quiet markets alike.
Bullish and Bearish Engulfing Reversal Mechanics
The engulfing pattern is a two-candle reversal signal. A bullish engulfing forms when a small red candle is followed by a larger green candle whose body completely covers the prior body. The mechanics: sellers controlled the first session, then buyers overwhelmed them on the second, pushing the close above the prior open. A bearish engulfing inverts the story, with a small green candle followed by a larger red candle whose body engulfs the prior session.
The pattern only matters at the right location. In the middle of a range, an engulfing candle is just a wide-range bar with no predictive value. At the end of a trend, against a tested support or resistance level, it becomes a potential reversal. Volume adds the second filter. A bullish engulfing on a volume spike greater than the prior 20-bar average carries more weight than the same pattern on below-average volume. The volume tells you whether the new participants showed up or whether the move was a low-conviction drift.
Consider a typical scenario: a stock like AAPL pulls back to a $150 support zone on the daily chart after a three-week correction. The first day prints a small bearish candle near the support. The next day opens lower, sellers push price under $148, then buyers reverse the move and close near $152 with a full bullish engulfing. Volume prints 2.3x the 20-day average. The setup is the pattern plus the support plus the volume. The stop sits below the prior candle’s low, framing the risk. That is a trade, not a picture. Without those three elements lining up, the same candle pattern is a coin flip.
The Doji Family: Gravestone, Dragonfly, and Long-Legged Variations
A doji forms when open and close are nearly equal, leaving a thin or absent body. The wicks tell the story. A gravestone doji has a long upper wick and no lower wick, showing buyers pushed price up before sellers crushed the close back to the open. A dragonfly doji inverts that: long lower wick, no upper wick, showing sellers drove price down before buyers recovered the session. A long-legged doji has wicks on both sides, showing violent two-way rejection and maximum indecision.
Dojis are indecision candles. In isolation, they signal nothing. After a strong trend, they warn that momentum is fading and the current participants are losing conviction. At a key support or resistance level, they mark a possible turning point where the auction has reached a balance between buyers and sellers. The doji that matters most sits at a price level the market has reacted to before, and gets confirmed by the candle that follows it. Without confirmation, the doji is a pause, not a reversal.
A useful rule: never trade a doji on its own. Wait for the next candle. If a dragonfly doji forms at a tested support on the EUR/USD daily chart, the bullish case requires the next session to close above the doji’s high. If the next candle closes below the doji’s low instead, the support is failing and the pattern is invalidated. The doji is a warning. The next candle is the verdict. Trading the doji without waiting for that verdict is how retail traders end up buying falling knives and selling into quiet bases.
Morning Star and Evening Star Three-Candle Setups
The morning star is a three-candle bullish reversal. A long bearish candle, a small-bodied indecision candle (often a doji or spinning top), then a long bullish candle that closes well into the first candle’s body. The pattern shows momentum shift in slow motion: sellers in control, exhaustion, then buyers taking over. The evening star is the mirror image at resistance, with a long bullish candle followed by indecision and then a strong bearish close that retraces into the first candle’s range.
The middle candle is the key. Its small body and gap-like structure show that the prior trend’s force has stalled. Without that pause, the pattern is just a two-bar continuation. The third candle confirms the reversal by closing past the midpoint of the first candle’s body. A weak third candle that barely recovers the midpoint weakens the signal considerably. The geometry of the three candles tells you how violent the shift in control has been.
Picture a TSLA weekly chart trading near its 200-week moving average after a year-long decline. The first week prints a long red candle. The second week is a small-bodied doji that opens lower but closes near the open, with a long lower wick showing rejection. The third week opens higher and closes near the weekly high on a clear volume spike. The morning star forms at a major moving average, with volume confirming. In such cases, multi-week reversal rallies of roughly 10% to 15% have historically followed similar structures, though past price action does not guarantee the next outcome. The trade plan: enter on the third candle’s close, stop below the doji’s low, target the prior swing high. The risk-reward is defined before the entry, not after.
Volume Confirmation and Wick Rejection Validation
Volume is the most underused filter in candlestick analysis. Every reversal pattern is stronger when the confirming candle prints on above-average volume. The average is your own: 20-bar simple volume for intraday and swing charts, 10-bar for longer-term weekly setups. A bullish engulfing on 1.5x average volume is acceptable. The same pattern on 0.6x average volume is suspect because it shows the move lacked participation.
Wicks carry their own evidence. A long lower wick on a bullish candle shows that sellers tested a level and buyers absorbed the supply. A long upper wick on a bearish candle shows buyers tested a level and sellers absorbed the demand. Wicks are footprints of rejected prices, the visual record of where one side of the market lost control. When a wick rejects a level that has already produced a reaction, the rejection has a name: failed auction.
In practice, this looks like a stock that breaks below a $50 support level on heavy volume, then prints a long lower wick the same session and closes back above $50. The breakout was a liquidity grab, a stop hunt designed to flush out weak hands before the real move. The wick rejection is the reversal signal. Without the wick, the close below $50 would be the trade. With the wick, the close back above is the trade. The shape is the same. The outcome is reversed. Reading that wick correctly is often the difference between a winning short and a losing long.
Multi-Timeframe Confluence and Trend Alignment
A single timeframe lies constantly. The 5-minute chart says buy, the hourly says sell, the daily is flat. Professional traders resolve this by reading at least three timeframes and demanding agreement. The principle is simple: the higher timeframe sets the bias, the middle timeframe defines the structure, and the lower timeframe delivers the entry. Trading against the higher timeframe bias is a low-probability setup that requires exceptional structure to justify.
The standard stack: a higher timeframe for trend, a middle timeframe for structure, and a lower timeframe for entry. For a swing trader, that means weekly for trend, daily for structure, and 4-hour for entry. For a day trader, hourly for trend, 15-minute for structure, and 1-minute or 5-minute for entry. The patterns only trigger in the direction of the higher-timeframe trend unless the setup is explicitly a reversal at a major level where the trend has been exhausted and tested multiple times.
A typical setup: EUR/USD on the daily chart is in a downtrend, lower highs printing consistently. On the 4-hour chart, price has just retested a broken structure level around 1.0950 from below and printed a bearish engulfing candle. The 1-hour chart shows RSI divergence, with price making a higher high but the RSI failing to confirm. All three timeframes agree: sellers are in control, the retest failed, momentum is fading. The short entry triggers on the 4-hour close below the engulfing candle’s low, with stop above the prior swing high. Three timeframes, one direction, one trigger. That is confluence, and it is the foundation of professional candlestick trading.
Step-by-Step Guide
A repeatable process keeps trading consistent when emotions run high. The following sequence is how experienced traders structure a candlestick read from chart open to trade execution.
Step 1: Identify the higher-timeframe trend. Start with the weekly or daily chart. Mark the direction of higher highs and higher lows, or lower highs and lower lows. The market is either trending up, trending down, or ranging. This decision governs everything downstream. A bullish pattern against a confirmed downtrend is a counter-trend trade and must meet a higher standard of confirmation.
Step 2: Mark key support and resistance levels. These are price zones where the market has reacted at least twice before. Horizontal levels, trendline confluences, and round numbers all qualify. Patterns only carry weight at these levels. A hammer in the middle of nowhere is noise.
Step 3: Drop to the trading timeframe. For a swing trader, that is the daily or 4-hour chart. For a day trader, the 15-minute or 5-minute. Watch for a candlestick pattern to form at one of the marked levels, with the pattern direction aligned to the higher-timeframe bias.
Step 4: Confirm with volume. The pattern candle, or the candle that confirms it, should print on above-average volume. For intraday charts, the 20-bar volume average is the standard reference. Without volume, the pattern lacks conviction.
Step 5: Validate with wick structure. Look for wicks that reject the level in the direction opposite to the pattern. A bullish reversal should show a long lower wick on the pattern or confirmation candle. A bearish reversal should show a long upper wick.
Step 6: Execute on the close. Enter after the confirmation candle closes, not during the pattern formation. The stop goes below the pattern low (for longs) or above the pattern high (for shorts). The target is the next structural level, with a minimum 2:1 reward-to-risk ratio.
Practical Tips for Better Results
Track every pattern signal in a trading journal. Note the location, volume, timeframe alignment, and outcome. After 100 trades, the data shows which patterns work in your market and which do not. Most traders discover that 80% of their profits come from 20% of their setups. The journal exposes that distribution.
Trade only patterns that form at meaningful levels. A doji in the middle of a range is decoration. A doji at a level the market has tested before is information. The location filter alone will eliminate half your losing trades.
Use a fixed position sizing model. Risk no more than 1% to 2% of account equity per trade, regardless of how compelling the pattern looks. Candlestick patterns are probabilistic, not deterministic. The losing streak will come. Position sizing keeps you in the game when it does.
Combine candlestick reads with one supporting indicator. RSI divergence, the 200-period moving average, or VWAP all work. The indicator is a tiebreaker, not a primary signal. Two confirming tools beat six conflicting ones.
Backtest before going live. Run the pattern rules on 10 years of historical data for the instrument you plan to trade. The backtest reveals the win rate, average winner, average loser, and max drawdown. If the pattern loses money on paper, it will lose money in real time.
Common Mistakes to Avoid
Trading patterns in isolation. A hammer with no context is a 50/50 coin flip. Context is the edge.
Ignoring volume. Patterns on declining volume are suspect. The market votes with participation, and the vote is the volume print.
Fighting the higher-timeframe trend. A bullish pattern on a 4-hour chart against a daily downtrend is a low-probability trade. Let the trend align or sit out.
Moving the stop loss. Once the stop is set below the pattern low, leave it there. Moving it wider to give the trade room is how small losses become account-killers.
Overtrading patterns. A hammer a week is a trade. Five hammers a day is gambling. Quality of setup always beats quantity of setups.
Skipping the confirmation candle. A doji on Monday does not mean anything until Wednesday’s candle confirms it. Patience is the edge.
Confusing a pattern with a prediction. A morning star at support increases the probability of a bounce. It does not guarantee one. Position sizing and stops handle the part the pattern cannot.
Frequently Asked Questions
What is the most reliable candlestick pattern for beginners?
The bullish and bearish engulfing patterns are the most reliable starting points because their mechanics are visually clear and the two-candle structure is easy to confirm. Combined with volume and a key support or resistance level, they offer a solid foundation for new traders learning to read price action.
How long does it take to master candlestick patterns?
Basic recognition can be learned in days. Real mastery, defined as consistent profitable application, typically takes 6 to 12 months of screen time, journaling, and live trading. The learning curve is steep at the start and flattens as pattern recognition becomes intuitive.
Do candlestick patterns work on all timeframes?
Yes, the same patterns appear on 1-minute charts, daily charts, and weekly charts. Reliability increases with timeframe because higher timeframes aggregate more data and reduce noise. A weekly engulfing carries more weight than a 1-minute engulfing for the same instrument.
Should I use candlestick patterns alone or with other indicators?
Use candlestick patterns as the primary read of price action, then add one or two supporting indicators as filters. RSI, moving averages, and VWAP all pair well. Avoid stacking indicators; the goal is confluence, not confirmation overload.
What is the biggest mistake traders make with candlestick patterns?
Trading patterns without context. The pattern is one data point. Without the location, the volume, and the higher-timeframe agreement, the pattern is decorative. Most candle-based losses come from entries that ignored context.
How do I practice candlestick reading without risking money?
Open a brokerage demo account or use a free charting platform with historical replay. Mark every reversal pattern you see over a 100-candle window, then check what price did next. The exercise builds pattern recognition without risking capital.
Conclusion
Mastering candlestick patterns is not about memorizing shapes. It is about reading the auction process that produces those shapes and confirming the read with volume, wick structure, and higher-timeframe agreement. The edge is in the framework, not the candle.
Treat every pattern as a clue, not a command. Confirm with context, manage risk with fixed position sizing, and journal every trade so the data tells you which setups actually work. The pattern is the entry. The process is the edge. Stay disciplined, trust the read, and let the probabilities work over hundreds of trades rather than chasing a single signal.
This article is for educational purposes only and does not constitute investment advice. Trading and investing carry risk of loss; never invest more than you can afford to lose. Past price action does not guarantee future results.
Last reviewed: August 2026


