


















































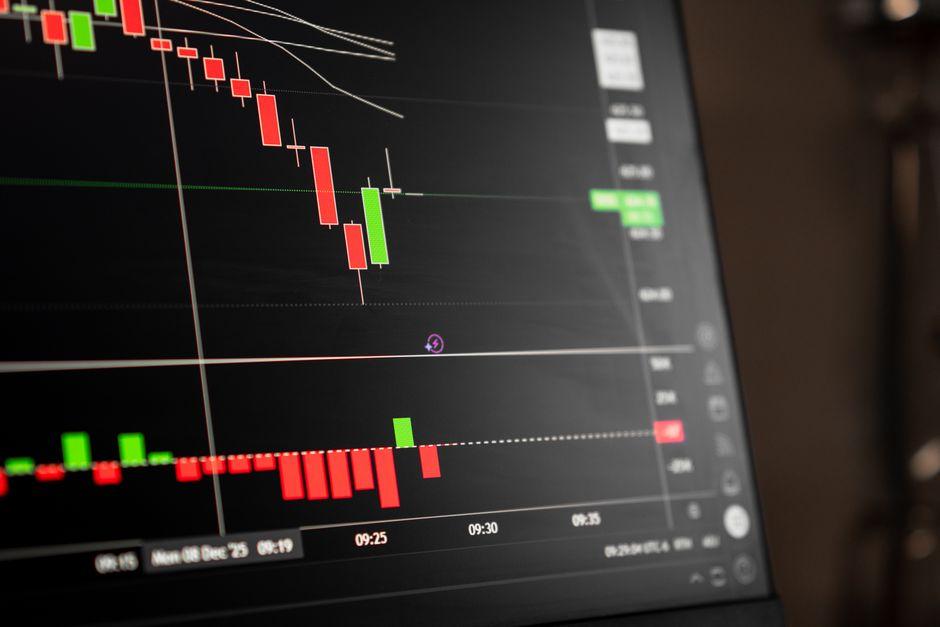
How to Know Price Action Trading Signals in Real Time

Table of Contents
- Introduction
- What Is Price Action Trading?
- Why Price Action Matters for Traders and Investors
- Core Concepts
- Step-by-Step Guide to Identifying Signals
- Practical Tips for Better Results
- Common Mistakes to Avoid
- Frequently Asked Questions
- Conclusion
Introduction
The ability to know price action signals in real time sits at the center of professional trading, and mastering this skill fundamentally changes how a market participant approaches the screen.
Consider a trader monitoring S&P 500 futures during a Federal Reserve interest rate announcement. The price spikes violently, triggering several lagging indicators to flash a buy signal. However, a closer look at the candles reveals long upper wicks and a failure to close above the previous swing high. While the indicators suggest momentum, the raw price movement reveals a massive absorption of buy orders by institutional sellers. The trader who can read these signals avoids the bull trap and instead waits for a structural shift to initiate a short position.
The primary hurdle for most retail traders is an over-reliance on lagging indicators. Moving averages and oscillators describe what has already happened; they do not tell you what is happening now. In a high-volatility environment, waiting for an indicator to confirm a trend often means entering a trade after the move is exhausted. This lag leads to poor risk-reward ratios and frequent, avoidable drawdowns.
To survive in professional markets, you must shift your focus from mathematical derivatives to the raw data: price and volume. This guide provides a mechanical framework to help you know how to filter market noise and identify high-probability price action signals in real time.
What Is Price Action Trading?
Price action trading is the discipline of analyzing the raw movement of an asset’s price to forecast future moves without relying on lagging technical indicators. It treats the price chart as a real-time map of buyer and seller psychology, where every candle represents a battle for value between opposing forces.
For example, if the EUR/USD pair approaches a historical support level and forms a bullish pin bar—a candle characterized by a long lower wick and a small body—price action traders do not check an RSI reading. Instead, they interpret the long wick as evidence that sellers attempted to push the price lower, failed, and were aggressively bought out by institutional liquidity. The signal is the rejection itself, not a line on a graph.
Why Price Action Matters for Traders and Investors
Price action is the only leading data point in the market. Every indicator, from the MACD to Bollinger Bands, is simply a mathematical calculation derived from price. By removing the middleman, you reduce the lag between the market’s move and your execution.
Institutional players, such as hedge funds and investment banks, do not trade based on Golden Crosses. They operate based on liquidity pools, order flow, and structural breaks. When you learn how to know these signals, you align your trades with smart money rather than following retail patterns that are often targeted for liquidity hunts.
Ignoring price action leaves a trader vulnerable to fakeouts. Someone relying solely on a trend-following indicator might remain long during a clear double-top formation, ignoring the fact that the market has stopped making higher highs. By the time the indicator turns bearish, the asset may have already dropped 5%, resulting in a significant loss of capital.
Candlestick Psychology and Rejection Wicks
A candlestick is more than a geometric shape; it is a record of sentiment over a specific timeframe. The body represents conviction, while the wicks represent rejection. When price hits a level and snaps back quickly, it leaves a rejection wick. This indicates a large concentration of resting orders at that price, creating a formidable barrier.
Consider a scenario where Bitcoin is trending upward and hits a psychological resistance level at $70,000. If a candle reaches $70,500 but closes at $69,800, leaving a long upper wick, it signals that sellers are defending that zone. This is a real-time signal that bullish momentum is stalling, providing a high-probability opportunity to tighten stop-losses or look for a reversal.
Market Structure: Higher Highs and Lower Lows
Market structure defines the current regime. A bullish trend is characterized by a series of higher highs (HH) and higher lows (HL). Conversely, a bearish trend consists of lower highs (LH) and lower lows (LL). The most critical signal in price action is the Break of Structure (BOS), which occurs when the previous HL or LH is breached.
For example, if the Nasdaq 100 is making higher highs and higher lows, the trend is bullish. But if the price suddenly drops and closes below the most recent higher low, the structure is broken. This shift suggests that buyers are no longer in control and the regime may be transitioning from a trend to a range or a full reversal.
Support and Resistance Confluence Zones
Support and resistance are not thin lines but zones of interest. Confluence occurs when multiple price action signals align at the same level—such as a historical support zone overlapping with a round psychological number and a Fibonacci retracement level.
Imagine the GBP/USD pair dropping toward a zone that served as a major floor three months ago. If the price enters this zone and forms a bullish engulfing pattern—where the second candle completely covers the first—you have confluence. The historical support provides the location, and the engulfing candle provides the real-time signal to enter.
Volume Profile and Order Flow Validation
Price action tells you where the market is going; volume tells you if the move is real. The Volume Profile shows the price levels where the most trading activity occurred. A high volume node acts as a magnet or a strong barrier, while low volume nodes are areas where price tends to move through quickly.
In a real-time scenario, if you see a price breakout above a resistance level on the S&P 500, you must verify the volume. A breakout on low volume is often a bull trap designed to lure in retail buyers before the price crashes. Conversely, a breakout accompanied by a surge in volume suggests that institutional players are committing capital, validating the signal.
Step-by-Step Guide to Identifying Signals
Step 1: Determine the Market Regime
Before looking for a signal, identify if the market is trending or ranging. Use a higher timeframe, such as the Daily or 4-Hour chart, to see the overall structure. If the price is making clear higher highs, you are in a bullish regime. If it is bouncing between two horizontal levels, you are in a range.
The decision here is straightforward: in a trend, you look for buy the dip or sell the rip signals. In a range, you look for mean-reversion signals at the boundaries. Trying to use a trend-following strategy in a sideways market is a fast way to erode an account through small, frequent losses.
Step 2: Identify the Area of Value
Do not trade in the middle of the range. Wait for the price to enter a zone of interest. This could be a previous support or resistance level, a supply or demand zone, or a major psychological level, such as $100 for a specific stock.
For example, if you are trading the EUR/USD 4-hour chart, you might identify a Break-and-Retest pattern. The price breaks above a resistance level, then returns to that same level to test it as new support. The Area of Value is the zone where the old resistance now acts as support.
Step 3: Wait for the Execution Signal
Once the price is in the Area of Value, look for a specific candlestick confirmation. This is the trigger. Common triggers include pin bars, engulfing candles, or inside bars.
If the price has returned to the break-and-retest zone on the EUR/USD, you do not simply buy blindly. You wait for a bullish pin bar to form on the 1-hour or 15-minute chart. This confirms that the support is holding in real time.
Step 4: Define Risk and Position Sizing
Before clicking buy or sell, determine where the trade is proven wrong. The stop-loss should be placed beyond the signal candle’s wick or outside the structural zone. Calculate your position size based on a fixed percentage of your account, such as 1% per trade, to avoid catastrophic drawdowns.
If your stop-loss is 20 pips away and your target is 60 pips, you have a 1:3 risk-reward ratio. If the target is too close or the stop is too wide, the trade is not viable, regardless of how perfect the price action signal looks.
Practical Tips for Better Results
- Trade the Close: Never enter a trade based on a candle that hasn’t closed. A bullish pin bar can turn into a bearish engulfing candle in the final seconds of the timeframe.
- Use Multi-Timeframe Analysis: Always check the Anchor Chart (Daily) for direction and the Entry Chart (15m or 1h) for the signal. A bullish signal on a 5-minute chart is irrelevant if the Daily chart is in a massive downtrend.
- Focus on Fresh Levels: The first time a price returns to a support level, the signal is strongest. Every subsequent touch weakens the level as the resting orders are consumed.
- Watch the VIX: In equity markets, the VIX (Volatility Index) can indicate if a price action signal is likely to be erratic. High VIX environments often lead to stop hunts where price spikes past a level before reversing.
- Prioritize Liquidity: Trade assets with high liquidity, such as EUR/USD, S&P 500, or Gold. Low-liquidity assets produce gap-y price action and slippage, making precise stop-losses ineffective.
- Keep a Visual Journal: Screenshot your entries and exits. Over time, you will notice that your most successful trades share the same structural characteristics.
Common Mistakes to Avoid
- Trading in the Void: Entering a trade when the price is between support and resistance. This results in low-probability trades with poor risk-reward ratios.
- Over-Analyzing the Chart: Adding ten different indicators to confirm a price action signal. This creates analysis paralysis and usually leads to entering the trade too late.
- Revenge Trading After a Fakeout: A price action signal can fail. Trying to win it back by increasing position size usually leads to a total account wipeout.
- Ignoring the News Calendar: Trading a technical signal right before a Non-Farm Payroll (NFP) or CPI release. High-impact news can blow through any support or resistance level regardless of the signal.
- Confusing a Pullback for a Reversal: Selling a small dip in a strong uptrend because you saw one bearish candle. A reversal requires a break of structure, such as a lower low, not just a single candle.
How do I know if a price action signal is fake?
A signal is often fake if it occurs in isolation without structural confluence. For example, a bullish pin bar in the middle of a downtrend, far from any support zone, is likely a temporary pause rather than a reversal. True signals align with the overall trend or occur at major historical levels.
What are the most reliable price action patterns for beginners?
The Break-and-Retest and the Pin Bar at a major support or resistance level are the most reliable. These patterns are easy to identify and provide a clear location for the stop-loss. Beginners should focus on these two before moving to more complex patterns like the Three-Drive or Quasimodo.
Why is price action better than using indicators?
Indicators are derivatives of price; they are always lagging. Price action is the actual data. By reading the candles, you see the immediate reaction of buyers and sellers, allowing you to enter trades earlier and with more precise risk management.
When is the best time of day to trade price action signals?
The highest probability signals occur during the overlap of major sessions, such as the London and New York sessions. This is when liquidity is highest and institutional volume is most active, ensuring that price moves are meaningful and not just random noise.
Can I use price action trading on a 1-minute chart?
Yes, but the noise increases significantly on lower timeframes. A 1-minute signal is only reliable if it aligns with the trend of a higher timeframe, such as the 15-minute or 1-hour chart. Scalping on the 1-minute chart requires extremely fast execution and tight spreads.
Is price action trading effective in a sideways market?
Yes, but the strategy must change. In a trending market, you look for continuations. In a sideways market, you trade the extremes—selling at the top of the range and buying at the bottom. The key is to identify the range boundaries and wait for rejection signals.
Conclusion
The ability to know price action signals in real time is the difference between guessing and calculating. The most important lesson is that a signal is only as strong as the context surrounding it. A perfect pin bar means nothing in a vacuum, but it means everything when it appears at a high-volume node during a structural retracement.
Your next step is to open a demo account or a chart and identify ten Break-and-Retest patterns on a 4-hour timeframe. Do not trade them; simply mark the zones and observe how the price reacts. This builds the pattern recognition necessary for live execution.
Trading involves significant risk of loss. No strategy, including price action, guarantees a profit. Always use a stop-loss, never risk more than you can afford to lose, and prioritize capital preservation over aggressive gains.
*
Disclaimer: Trading financial instruments involves significant risk. The analysis provided here is for educational purposes and does not constitute financial advice. Past performance is not indicative of future results.
—
This article is for educational purposes only and does not constitute investment advice. Trading and investing carry risk of loss; never invest more than you can afford to lose.
Last reviewed: August 2026


