


















































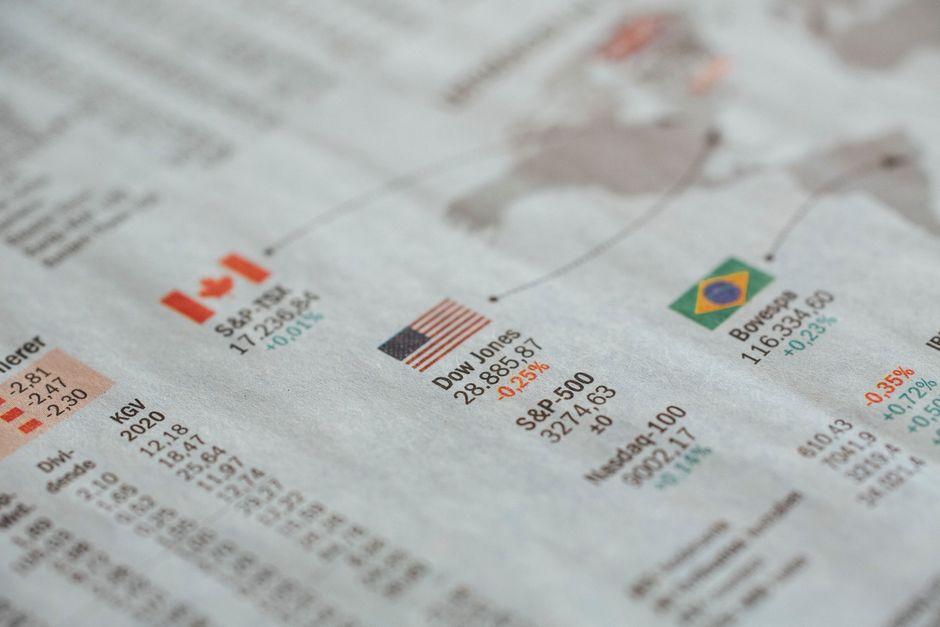
Dow Jones Price Action Analysis for Trading Sessions

Table of Contents
- Introduction
- What Is Dow Jones Price Action Analysis
- Why Price Action Matters for Traders and Investors
- Core Concepts
- Step-by-Step Guide to Analyzing Dow Jones Price Action
- Practical Tips for Better Results
- Common Mistakes to Avoid
- Frequently Asked Questions
- Conclusion
Introduction
The opening bell rings and futures traders are already scanning their screens for an edge. The Dow Jones Industrial Average futures are trading around key psychological levels, and the question on every trader’s mind is simple: which direction does this market want to go today?
Price action analysis gives you a framework to answer that question without relying on lagging indicators or overcomplicated systems. By reading the raw price data, you can identify where institutional buyers and sellers are stepping in, recognize early warning signs of trend exhaustion, and time your entries with better precision. This approach works across timeframes, from intraday futures trades to swing positions held over several days.
This guide walks you through the core concepts of Dow Jones price action, shows you how to apply them to real trading scenarios, and helps you build a repeatable process for analyzing market direction before the session begins.
What Is Dow Jones Price Action Analysis
Dow Jones price action analysis is the practice of reading raw price movements on the DJIA to predict future price direction. Instead of relying on moving averages, RSI, or MACD, you focus on where prices have actually been, where they stalled, and how candles formed at those critical moments.
The premise is straightforward: price reflects all available information. When buyers aggressively push prices higher at a specific level, that level becomes support. When sellers repeatedly reject prices at a ceiling, that ceiling becomes resistance. By studying these interactions, you can anticipate where the next move might stall or reverse.
Consider a trader watching DJIA futures who notices price approached the 41,200 level three times over the past week. Each time, buying pressure stepped in and pushed prices back above that zone. On the fourth approach, a bullish engulfing candlestick forms, suggesting the support level is holding and a bounce is likely. That is price action in practice.
Why Price Action Matters for Traders and Investors
Traders who rely solely on indicators often miss the underlying market dynamics. An RSI reading of 70 might suggest overbought conditions, but if price is accelerating into a breakout, fighting that momentum based on one indicator can be costly.
Price action matters because it shows you where the battle between buyers and sellers is actually being fought. The Dow Jones leads market direction because it represents 30 blue-chip companies across multiple sectors. When these heavyweights move, other markets often follow. Reading the Dow’s price action gives you a signal other markets have not yet priced in.
Ignoring price structure means trading blind. You might enter a long position because an indicator turned green, only to discover you bought into a resistance level where sellers are waiting. Price action analysis helps you avoid these costly mistakes by showing you the exact levels where the market has previously rejected price.
Support and Resistance Levels
Support and resistance are horizontal price zones where the market has previously reversed. A support level is where buying pressure exceeded selling pressure, causing price to bounce higher. A resistance level is the opposite: selling pressure overwhelmed buyers, pushing price back down.
What makes a level significant is the number of times price has reacted to it. A level tested twice carries less weight than one tested five times. The more touches, the more traders are watching and acting at that zone.
A trader identifies a key support level at 41,200 on the DJIA futures and places a long position as price bounces off the level with a bullish engulfing candlestick pattern. The stop-loss sits just below 41,150, giving the trade room to breathe while risking only a small portion of the account. This is how price action informs both entry and risk management.
Candlestick Pattern Formations
Individual candlesticks tell a story about what happened during a specific period. A long green candle with a small wick shows strong buying pressure throughout the session. A long red candle with a small wick shows the opposite. Small-bodied candles with long wicks indicate indecision.
Certain patterns carry more weight at support and resistance levels. A shooting star at resistance often signals rejection and potential reversal. A hammer at support suggests buyers stepped in aggressively after the selloff. Doji candles near key levels indicate the market is undecided, often setting up a breakout in the direction of the prevailing trend.
A swing trader notes the Dow Jones rejected off the 41,800 resistance level three times and sets up a short position when price forms a shooting star candlestick on the fourth approach. The pattern confirms seller exhaustion at a known ceiling, giving the trader confidence to enter before the inevitable pullback.
Trend Structure and Trendlines
A trend is simply a series of higher highs and higher lows in an uptrend, or lower highs and lower lows in a downtrend. Price action analysis uses these structural elements to identify when a trend is intact and when it might be reversing.
Trendlines add another dimension. A descending trendline connects lower highs, and a break above that line often signals a trend change. Conversely, an ascending trendline connecting higher lows, when broken to the downside, suggests the uptrend has faltered.
A day trader watches the Dow Jones break above a descending trendline at 41,500 and enters a momentum long position with the 50-period moving average as dynamic support. The trendline break confirms the downtrend has ended, and the moving average provides a reference point for exiting if price pulls back.
Horizontal Price Levels
Beyond support and resistance, horizontal levels include psychological levels (round numbers like 41,000), gap boundaries, and previous swing highs and lows. These levels matter because many traders place orders at round numbers, and market makers often target these zones.
Psychological levels act as informal support and resistance. When the Dow trades through 42,000, the next psychological level is 43,000. Trading activity often clusters around these numbers, creating self-fulfilling dynamics that price action traders exploit.
Price Momentum Indicators
While pure price action traders avoid indicators, momentum indicators can confirm what price is already showing. The Average True Range (ATR) measures volatility, helping you set appropriate stop distances. The ADX indicates trend strength without predicting direction. Using these tools to confirm price action, rather than lead it, keeps your analysis grounded in what the market is actually doing.
Step-by-Step Guide to Analyzing Dow Jones Price Action
Step 1: Identify the Prevailing Trend
Before looking for entries, determine whether the market is trending up, down, or sideways. On a daily chart, draw a simple trendline connecting the most recent swing highs or lows. If price is making higher highs and higher lows, you are in an uptrend. The opposite signals a downtrend.
In a ranging market, support and resistance levels take priority over trend-following strategies. Trading with the trend in a ranging environment often leads to false breakouts and losing trades.
Step 2: Map Key Support and Resistance Levels
Locate the three most significant horizontal levels on your chart. Focus on levels where price has reacted at least twice. Mark psychological levels as secondary references.
For intraday analysis, zoom into the previous day’s range and the current session’s opening range. These zones often determine where price stalls or continues. Write these levels down before the session begins so you are not scrambling to find them when opportunity strikes.
Step 3: Wait for Price to Reach Your Level
Patience is the most difficult part of price action trading. Do not chase price into a level. Wait for price to arrive at your identified support or resistance zone, then watch for a reaction. A bullish candlestick pattern at support or a bearish pattern at resistance provides the confirmation you need.
If price moves through a level without hesitation, that level is invalidated. Move to the next significant zone rather than forcing a trade at a level that no longer holds.
Step 4: Execute with Defined Risk
Once you see a clear price action signal at your level, calculate your position size before entering. Never risk more than one to two percent of your account on a single trade. Place your stop-loss just beyond the level, accounting for normal market volatility.
A tight stop at a key level with the pattern confirming your direction gives you a favorable risk-reward ratio. If the setup fails, you know immediately and can move on to the next opportunity.
Practical Tips for Better Results
- Trade during the most liquid hours. The Dow Jones futures market is most active during the New York session open (8:30 AM to 11:00 AM ET) and the overnight session overlap. Volume drops during lunch hours, making price action signals less reliable.
- Combine multiple timeframes. Identify the trend on a daily chart, then look for entries on a 15-minute or hourly chart. This alignment increases your probability of success.
- Use the opening range as a reference. The first 30 to 60 minutes of trading often establish the day’s range. Breakouts above or below this range frequently lead to trending moves.
- Track market breadth alongside price. When the Dow makes a new high but advancing stocks are declining, the move lacks sustainability. This divergence often precedes reversals.
- Keep a trading journal. Record every price action setup, the reason you entered, and the outcome. Over time, you will identify which patterns work best in your trading timeframe.
- Adjust for volatility. When the VIX spikes, expect wider ranges and more aggressive moves. Tight stops get hunted during volatile sessions. Give your trades room to absorb normal fluctuations.
- Do not force trades. Some days the market does not present clear setups. Accept this and wait for the next session. Forcing entries leads to cumulative losses.
Common Mistakes to Avoid
- Trading every touch of a level. Not every approach to support warrants a long entry. Wait for a confirmed reversal pattern before acting. Entering on every bounce increases your loss rate.
- Ignoring the broader market context. The Dow does not trade in isolation. Check the S&P 500 and Nasdaq for confirmation. If the Dow breaks resistance but the S&P 500 is falling, the breakout may fail.
- Setting stops too tight. Market noise often triggers stops just before the trade works. Place stops beyond a reasonable noise margin, typically the recent swing low for longs or swing high for shorts.
- Overtrading. Quality beats quantity in price action trading. Three solid setups per week typically outperform fifteen mediocre entries. Each trade carries transaction costs and emotional weight.
- Abandoning your plan when trades go wrong. Losing trades are part of the process. Stick to your predefined risk and exit rules. Deviating because of frustration leads to larger losses.
- Chasing price after a missed entry. If you did not enter at your planned level, do not chase. Wait for the next approach or look for a different setup. Chasing puts you in a reactive position that usually ends poorly.
Frequently Asked Questions
How do I read Dow Jones price action for day trading?
Focus on the opening range, significant support and resistance levels, and candlestick patterns at those levels. Look for breakouts above the opening range or bounces off key levels with confirmation candles. The 15-minute and hourly charts provide the clearest intraday signals.
What is the best time to trade Dow Jones futures?
The most liquid and volatile periods are the New York session open (8:30 AM to 11:00 AM ET) and the overnight session overlap (8:00 PM to 4:00 AM ET). Lunch hours typically offer less direction and wider spreads.
Why does the Dow Jones lead market direction?
The Dow Jones consists of 30 large-cap companies spanning multiple sectors. Their collective movement reflects broad economic sentiment and often anticipates moves in other indices. When these blue-chip stocks establish a clear direction, other markets tend to follow.
Can I trade Dow Jones with price action alone?
Yes. Price action analysis provides everything you need: entry signals, stop placement, and profit targets. Indicators are optional and should only confirm what price is already showing. Many successful traders use pure price action without any indicators.
Is Dow Jones price action different from forex price action?
The mechanics are identical. Both markets reflect supply and demand dynamics, support and resistance, and candlestick patterns. The difference lies in liquidity, typical volatility, and the specific levels that matter. The Dow tends to respect round numbers more visibly than major forex pairs.
How do I identify support and resistance on the Dow Jones?
Start with the daily chart and mark all levels where price reversed at least twice. Add psychological levels (41,000, 42,000) and the previous day’s high, low, and close. On intraday charts, these levels become sharper and more actionable.
Conclusion
Reading Dow Jones price action is not about predicting the future. It is about recognizing where the market has already shown its hand and positioning accordingly. Support and resistance levels reveal where buyers and sellers have clashed. Candlestick patterns confirm the balance of power at those critical junctures. Trend structure tells you which direction the path of least resistance favors.
Build your analysis around these core principles, wait for clear setups, and manage your risk on every trade. No single article will make you profitable overnight, but a disciplined approach to price action gives you a framework to improve over time.
Start by identifying three key levels on the daily Dow Jones chart before your next trading session. Watch how price reacts to those levels. The patterns you observe will teach you more than any indicator ever could.
—
This article is for educational purposes only and does not constitute investment advice. Trading and investing carry significant risk of loss; never invest more than you can afford to lose. Past performance does not guarantee future results.
Last reviewed: August 2026


