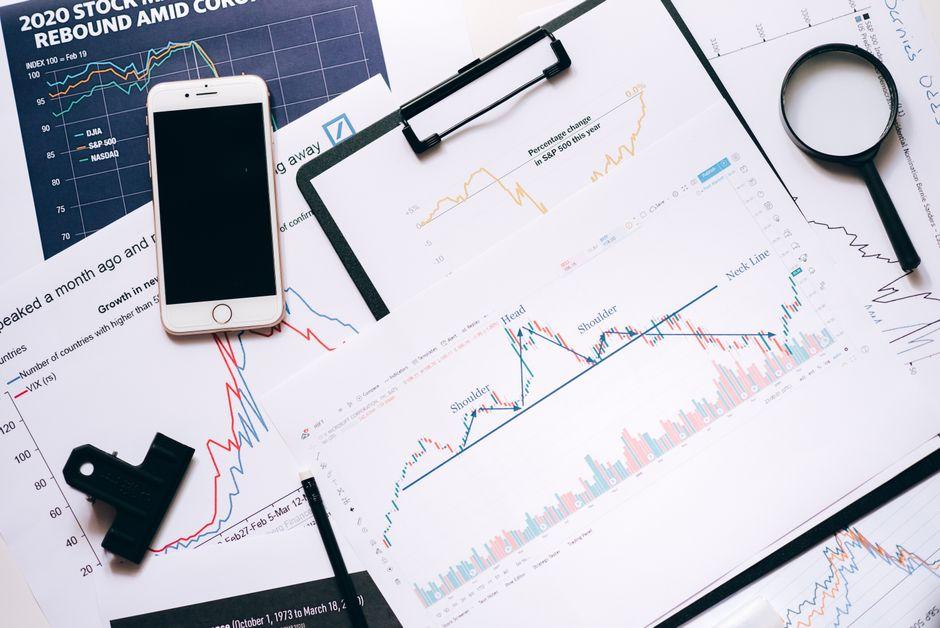
Best Trendlines Tools for Technical Analysis in 2024

Table of Contents
- Introduction
- What Are Trendline Tools?
- Why Trendline Tools Matter for Traders and Investors
- Core Concepts
- Step-by-Step Guide to Choosing Trendline Tools
- Practical Tips for Better Results
- Common Mistakes to Avoid
- Frequently Asked Questions
- Conclusion
Introduction
Best trendlines sits at the center of this guide, and understanding it changes how traders approach the market.
You’re looking at a daily chart of NVIDIA. The stock has been climbing for months, but lately it’s been churning—bouncing between $450 and $480. You can see the pattern forming, but manually drawing every swing high and low takes time you don’t have during market hours. Worse, you keep redrawing lines as new price data comes in, second-guessing whether that touch three days ago actually counts as a valid test of support.
This is the problem every active trader faces: trendlines are simple in concept but tedious in practice. The difference between a well-drawn trendline and a sloppy one can mean the difference between catching a breakout and missing it—or worse, getting stopped out on a false break. That’s where the right trendline tools make a material difference.
This guide compares the best trendline tools for technical analysis in 2024. You’ll learn what separates manual drawing tools from automated detection, which platforms offer the most useful features, and how to choose based on your trading style and budget. Whether you trade equities, forex, or crypto, the right tool can speed up your chart analysis without sacrificing accuracy.
What Are Trendline Tools?
Trendline tools are software features built into trading platforms that help traders draw, measure, and analyze trendlines on price charts. They range from simple manual drawing pencil tools to sophisticated automated systems that detect trendlines using algorithms.
The most basic form is a manual trendline tool—you click two points on a chart, and the platform draws a line connecting them. More advanced tools add features like automatic trendline detection, multi-timeframe overlays, slope angle measurement, and break confirmation indicators.
TradingView pioneered the modern approach to chart drawing tools, offering a free tier with strong manual capabilities and a premium tier that unlocks advanced features. TrendSpider took a different path, building its platform around automated technical analysis, including automatic trendline detection that identifies swing highs and lows without manual input. Other platforms like Thinkorswim, MetaTrader, and Ninjatrader offer their own implementations, each with distinct strengths and limitations.
The core function remains the same across all platforms: translating price action into visual lines that help traders identify trend direction, support and resistance zones, and potential breakout or breakdown points.
Why Trendline Tools Matter for Traders and Investors
Trendlines are foundational to technical analysis. They distill complex price action into simple visual references—lines that show where the market has found buying or selling pressure in the past. When price approaches a trendline, traders watch for reactions: bounces that confirm the trend, or breaks that signal a potential reversal.
The problem is that drawing accurate trendlines takes practice and time. A swing trader analyzing a dozen stocks across multiple timeframes might spend minutes per chart just drawing lines—time that adds up when markets are open. Automated tools reduce this workload, but they introduce their own challenges: false signals, over-reliance on algorithms, and the risk of missing context that a human trader would catch.
Your choice of trendline tool affects three practical areas:
– Speed: Automated detection scans entire price histories in seconds. Manual drawing takes longer but gives you control over which pivots matter.
– Consistency: Algorithms apply the same rules every time. Manual drawing varies from trader to trader and from day to day.
– Accuracy: The best tools combine both—automated detection as a starting point, with manual refinement to filter noise.
Ignoring trendline tools altogether means relying on visual chart analysis alone. This works for experienced traders who have internalized pattern recognition, but it limits scalability. As you add markets, timeframes, or securities to your watchlist, the time investment grows impractical.
Automatic Trendline Detection Algorithms
Automatic detection uses algorithms to scan price data and identify significant swing highs and lows, then connect them to form trendlines. TrendSpider’s system, for example, analyzes pivots based on user-defined sensitivity settings—you choose how many bars must constitute a swing, and the algorithm draws lines connecting those pivots.
The advantage is speed. A task that would take ten minutes manually—scanning a year of daily data for the most relevant highs and lows—completes in seconds. The algorithm doesn’t fatigue or suffer from confirmation bias.
The limitation is context. An algorithm connects the most recent pivots it finds relevant, but it can’t distinguish between a trendline that has been tested dozens of times (high-confidence support) versus one drawn through two random price spikes. You still need to evaluate whether the detected lines make sense.
In practice, many traders use automatic detection as a first pass, then refine the results. You might let the algorithm draw twenty trendlines on a chart, then delete the ones that don’t align with obvious price action, keeping only the lines that connect meaningful pivots.
Multi-Timeframe Trendline Overlay
Multi-timeframe analysis means drawing trendlines on one timeframe while viewing lines from a higher or lower timeframe simultaneously. A trader on a 15-minute chart might overlay the daily trendlines to see whether the intraday pullback is approaching a significant daily support level.
TradingView supports this through its “higher timeframe” feature, which displays trendlines from a timeframe you select on the chart you’re analyzing. TrendSpider offers a similar function through its multi-timeframe analysis tabs, letting you view daily and intraday charts side by side with trendlines visible on both.
This matters because trends exist at multiple scales. A stock might be in a clear uptrend on the daily chart while forming a short-term descending channel on the 60-minute chart. Multi-timeframe trendline overlay helps you identify entries that align with the broader trend—a key principle in technical analysis.
Consider a swing trader looking at Tesla. The daily chart shows a clear uptrend line drawn from the March lows. On the 15-minute chart, the trader notices a pullback that approaches the daily trendline. Rather than guessing whether the pullback will reverse, the trader uses multi-timeframe overlay to confirm the daily trendline is intact, then enters a long position on the 15-minute chart as price bounces.
Price Touch Validation and False Break Filters
A trendline is only useful if price actually respects it. A line drawn through random noise isn’t support or resistance—it’s just a line. Price touch validation refers to the process of confirming that a trendline has been tested multiple times, which increases its significance as a support or resistance level.
Some platforms automate this analysis. TrendSpider, for example, shows how many times price has touched each detected trendline, along with how close each touch came to the line. This helps traders distinguish between a trendline tested three times (high-confidence) versus one tested once (low-confidence).
False break filters add another layer. A false break occurs when price penetrates a trendline but then reverses back above or below it—trapping traders who entered on the breakout. Some tools incorporate volume analysis to filter false breaks: a breakout accompanied by above-average volume is more likely to hold than one with weak volume.
The practical application: before entering a trade based on a trendline break, check whether the break meets your validation criteria. Has the trendline been tested multiple times? Is volume confirming the move? Is the break cleanly above the line, or is there a doji or spinning top suggesting hesitation?
Slope Angle Calculation and Trend Strength Measurement
The angle of a trendline conveys information about momentum. A steep ascending trendline indicates strong buying pressure—a nearly vertical line suggests the rally may be unsustainable and prone to sharp pullbacks. A shallow trendline indicates weaker momentum, more prone to consolidation or reversal.
Most platforms calculate the slope automatically, displaying the angle in degrees. TradingView’s trendline tool shows the slope percentage when you hover over a line. TrendSpider displays the angle as part of its automated trendline data.
This matters for position sizing and risk management. A position entered near a steep trendline faces higher risk if that line breaks—the move might be violent. A position entered near a shallow trendline might have more room to breathe, but the trend itself may be weaker and more prone to failure.
In practice, traders use slope angle to gauge whether a trend is accelerating, decelerating, or consolidating. A trendline that flattens over time suggests momentum is waning, even if price remains above the line. A trendline that steepens suggests momentum is building.
Trendline Break Confirmation with Volume Indicators
Entering a trade on a trendline break requires confirmation. Without it, you’re trading on a single candle’s behavior—which is speculation, not analysis. Volume indicators provide that confirmation.
When price breaks below an ascending trendline, the break is more credible if volume increases during the break. Similarly, a break above a descending trendline with above-average volume suggests real selling pressure has exhausted and buyers are stepping in.
Trading platforms integrate volume indicators with trendline analysis in different ways. TradingView lets you overlay volume bars directly on the price chart, making it easy to visually compare trendline breaks with volume spikes. TrendSpider automates this analysis by flagging breaks that occur with volume confirmation versus those that don’t.
The mechanism works because volume reflects participation. A breakout with low volume might be a short-covering rally or a false move driven by thin liquidity. A breakout with high volume reflects broad participation—a more sustainable move.
Step 1: Assess Your Trading Style
Your trading timeframe determines which features matter most. Intraday traders need speed and multi-timeframe support—tools that let you switch between 5-minute, 15-minute, and daily charts without redrawing everything. Swing traders care more about automated detection across longer timeframes, identifying weekly and monthly trendlines that define the broader trend.
If you’re a day trader executing multiple trades per session, automatic trendline detection saves time. If you’re a position trader who holds for weeks or months, manual drawing with strong persistence (lines that stay on the chart as you scroll through history) matters more than automated detection.
Step 2: Test Manual Drawing Tools
Before paying for automation, test the manual tools on each platform you’re considering. Create a free account on TradingView, load a chart you’re familiar with, and draw trendlines the way you would for your analysis. Ask: does the line snap to pivots automatically, or do you have to position it manually? Do the lines persist when you change timeframes? Can you save trendline templates to apply to multiple charts?
TradingView’s free tier is sufficient for this test. The manual drawing tools are strong, and you’ll quickly discover whether the platform’s interface suits your workflow.
Step 3: Evaluate Automated Detection
If you decide automation adds value, test it on TrendSpider or a platform that offers it. Run the automatic detection on a chart you’ve already analyzed manually—compare what the algorithm finds against what you identified. Look for false positives (lines through noise) and false negatives (obvious trendlines the algorithm missed).
The goal isn’t to find a perfect algorithm—none exist. The goal is to find an algorithm that speeds up your workflow without creating more cleanup work than it saves.
Step 4: Check Platform Pricing
TradingView’s subscription tiers range from free (limited features) to $60 per month for Pro+ with advanced charting. TrendSpider’s plans start around $30 per month for basic automated features, with higher tiers adding more complex analysis. Thinkorswim, MetaTrader, and Ninjatrader offer free or lower-cost options but with less sophisticated automated detection.
Calculate how many charts you analyze per week. If it’s under ten, the free or low-cost tiers may suffice. If you’re analyzing dozens of securities across multiple timeframes, the time savings from automation justify the subscription cost.
Step 5: Prioritize Integration With Your Broker
The best chart in the world is useless if you can’t execute trades from it. Check whether your broker integrates with the platform—TradingView connects to dozens of brokers directly, making it easy to place trades from the chart. TrendSpider also offers integrated broker connections. If your broker doesn’t integrate, you’ll need to switch platforms or accept the friction of executing elsewhere.
Practical Tips for Better Results
- Use automatic detection as a starting point, not a final answer. Let the algorithm identify candidates, then refine based on your own analysis of which pivots matter.
- Save your most-used trendline templates. If you regularly draw the same patterns (ascending channels, descending support), templates let you apply them in one click rather than redrawing each time.
- Combine trendlines with other indicators. A trendline break is more credible when confirmed by RSI divergence, MACD crossover, or volume spikes.
- Test your trendlines on multiple timeframes before entering a trade. A line that looks solid on the 15-minute chart might be irrelevant on the daily.
- Set price alerts on trendlines rather than watching screens constantly. Most platforms let you set alerts when price touches or breaks a drawn line.
- Redraw trendlines periodically as new price data arrives. A trendline that was valid last month may need adjustment as the market evolves.
- Document your trendline analysis. Screenshots or notes on why you drew a line where you did help you review decisions and improve over time.
Common Mistakes to Avoid
- Over-drawing: Loading a chart with twenty trendlines creates confusion, not clarity. Limit yourself to the most relevant lines—typically two to four per chart.
- Ignoring volume: Entering on a trendline break without checking volume leads to false breakouts. Always confirm with volume.
- Redrawing too frequently: Changing trendlines every time price makes a new high or low creates noise. Establish clear criteria for what constitutes a valid pivot before redrawing.
- Using automation without oversight: Automatic detection saves time but produces false positives. Review every automated line before trading on it.
- Confusing horizontal lines with diagonal trendlines: Support and resistance levels (horizontal) serve a different analytical purpose than trend direction (diagonal). Don’t treat them as interchangeable.
- Chasing steep trendlines: A nearly vertical trendline often breaks violently. The steeper the line, the smaller your position size should be.
- Entering without a plan for failure: If the trendline breaks, where do you exit? Defining your exit before you enter prevents emotional decision-making.
What is the best trendline tool for TradingView?
TradingView’s manual drawing tools are among the best in the industry, and the platform offers a free tier with substantial functionality. For automated detection, TradingView has third-party indicators available through its public library, though they’re not as integrated as dedicated automated platforms. The best approach is to start with TradingView’s free tools, then upgrade to a paid tier if you need more charts or advanced features.
How do I draw accurate trendlines on a chart?
Connect significant swing highs or lows—price points where the market reversed direction. Use a higher timeframe to identify the most relevant pivots, then draw trendlines on your trading timeframe. Aim for at least three touches to confirm the line is meaningful. Adjust the line visually to minimize the distance between the line and price, but don’t curve-fit to every wiggle.
Are automatic trendline tools better than manual drawing?
Neither is universally better. Automatic tools save time and apply consistent rules, making them useful for scanning multiple charts quickly. Manual drawing gives you control over which pivots matter and produces cleaner charts. Most experienced traders use both—automation for discovery, manual refinement for execution.
What is the difference between diagonal and horizontal trendlines?
Diagonal trendlines connect swing highs or lows to show trend direction—an ascending line indicates buying pressure, a descending line indicates selling pressure. Horizontal trendlines connect price levels where the market has repeatedly reversed, marking support or resistance zones. Both are useful but answer different questions.
Do professional traders use automated trendline software?
Many do, though preferences vary widely. Professional traders who analyze hundreds of securities use automation to speed up the screening process. Others prefer manual drawing because it forces deeper chart engagement. The deciding factor is whether automation improves your workflow without degrading your analysis quality.
Which trading platform has the best drawing tools for trendlines?
TradingView offers the best balance of drawing functionality and accessibility, with a free tier that satisfies most retail traders. TrendSpider excels for automated detection if you’re willing to pay for it. Thinkorswim and MetaTrader offer solid manual tools with broker integration. The best platform depends on your specific needs—test a few before committing.
Conclusion
Trendline tools exist to solve a practical problem: translating price action into visual patterns you can act on. The best tool isn’t the most expensive or the most automated—it’s the one that fits your trading style, saves you time, and produces analysis you trust.
Start with the free tier on TradingView to master manual drawing. If you find yourself spending too much time redrawing lines across dozens of charts, explore TrendSpider’s automated detection. Whatever you choose, remember that trendlines are only as good as the judgment behind them.
No tool replaces the need to understand price action, respect risk, and accept that breakouts fail more often than they succeed. Use these tools to organize your analysis, but make your trading decisions based on a complete picture—not a single line.
Trading involves substantial risk. Past performance does not guarantee future results. Always use proper position sizing and stop-losses when trading based on technical analysis.
—
This article is for educational purposes only and does not constitute investment advice. Trading and investing carry risk of loss; never invest more than you can afford to lose.
Last reviewed: August 2026