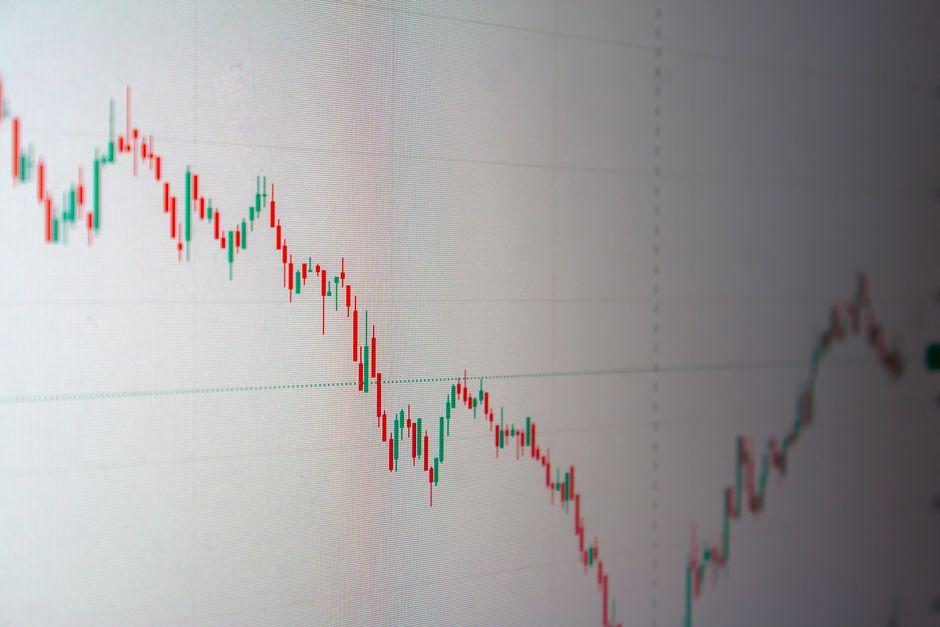
VWAP vs Moving Averages: TradingView Day Trading Guide

Table of Contents
- Introduction
- What Is VWAP and What Are Moving Averages
- Why These Indicators Matter for Day Traders
- Core Concepts
- Step-by-Step Guide to Using Both Indicators
- Practical Tips for Better Results
- Common Mistakes to Avoid
- Frequently Asked Questions
- Conclusion
Introduction
A day trader watching NVDA on a five-minute chart notices price pulling back toward a specific level during a morning rally. That level holds as support, and volume confirms the bounce. The trader enters long and captures the continuation. What made that level significant? It was the Volume Weighted Average Price, commonly called VWAP.
Meanwhile, another trader on a fifteen-minute TSLA chart watches the nine-period exponential moving average cross below the twenty-one-period EMA near that same VWAP level. The crossover confirms resistance, and the trader goes short. Both traders used moving averages and VWAP, but they applied them differently.
The confusion between these two indicators costs traders real money. They overlay both on their charts, get conflicting signals, and end up paralyzed or worse—trading against the very momentum they should be following. This guide resolves that confusion. It explains how VWAP differs from simple and exponential moving averages, when each works, and how to use them together without the conflict.
Throughout this article, you’ll learn the calculation mechanics, see concrete trading scenarios, and walk away with a step-by-step framework for applying these tools on TradingView.
What Is VWAP and What Are Moving Averages
VWAP stands for Volume Weighted Average Price. It calculates the average price a security has traded at throughout the day, weighted by volume. The formula uses typical price—(high + low + close) divided by three—and multiplies each period’s typical price by that period’s volume. The cumulative total of that product divided by cumulative volume produces the VWAP line.
TradingView calculates this automatically. The indicator resets at market open, meaning it starts fresh each trading session. This makes VWAP inherently an intraday tool. It reflects where the bulk of the day’s trading activity has occurred, weighted by how much volume passed through each price level.
Moving averages come in several forms. The Simple Moving Average (SMA) adds closing prices over a specified period and divides by that period count. Each price receives equal weight. The Exponential Moving Average (EMA) applies more weight to recent prices, making it more responsive to current price action. Traders commonly use periods like nine, twenty-one, fifty, and two hundred on intraday charts.
The key difference lies in what each indicator measures. VWAP emphasizes where volume has concentrated. Moving averages smooth price over time. Neither is inherently better—they answer different questions.
Why These Indicators Matter for Day Traders
Day traders operate on tight timeframes. They need to know whether a price level matters and whether momentum supports their trade direction. VWAP and moving averages answer these questions differently.
Institutional traders use VWAP to gauge execution quality. When a large buy order executes below VWAP, the trader achieved a better-than-average price. When it executes above VWAP, the price was worse than average. This institutional relevance means price tends to react around VWAP—buyers step in below it, sellers emerge above it.
Moving averages provide trend direction and potential support and resistance levels. A rising EMA cluster signals bullish momentum. A falling SMA signals bearish trend. Crossovers between fast and slow moving averages generate entry signals that many traders follow mechanically.
TradingView makes both indicators accessible. Adding them takes seconds. The challenge lies in understanding which signal to trust and when. Many traders stack multiple moving averages and VWAP together, creating a cluttered chart that produces analysis paralysis. The solution is not more indicators—it’s understanding how each functions and applying the right one for the current market condition.
VWAP Calculation Using Typical Price Weighted by Volume
The VWAP calculation integrates price and volume in a specific way. Typical price for each five-minute bar equals (High + Low + Close) / 3. Multiply typical price by the bar’s volume. Sum this product cumulatively throughout the session. Divide by cumulative volume. The result is the VWAP line that appears on your chart.
This weighting matters because it emphasizes price levels where more trading occurred. A price of $150 that traded one million shares influences VWAP more than the same price that traded ten thousand shares. VWAP becomes a volume-weighted equilibrium line—the fair value for the day based on actual market activity.
On TradingView, you add VWAP by clicking Indicators, typing “VWAP” in the search bar, and selecting it from the results. The default settings work for most traders. Advanced options allow you to modify the anchor (session, week, month) and add standard deviation bands for additional analysis.
Simple and Exponential Moving Average Crossover Mechanics
A moving average crossover occurs when a faster moving average crosses above or below a slower moving average. The nine-period EMA crossing above the twenty-one-period EMA generates a bullish signal. The opposite crossover generates a bearish signal.
The mechanics matter because different settings produce different results. A nine-period EMA reacts quickly to price changes—useful for capturing short bursts but prone to whipsaws in choppy markets. A fifty-period SMA moves slowly, filtering noise but lagging behind actual price moves. The lag means you enter after the move has started and exit after it has reversed.
Traders combine multiple moving averages to balance responsiveness and reliability. A common intraday combination uses nine, twenty-one, and fifty periods. The nine and twenty-one generate entry signals. The fifty confirms trend direction. When all three align—nine above twenty-one above fifty—the trend is strong. When they nest in the opposite direction, the trend is weak.
On TradingView, add moving averages by selecting Moving Average (SMA) or Moving Average Exponential (EMA) from the indicator menu. You can overlay multiple instances with different periods to build your crossover system.
VWAP Reset at Market Open and Intraday Session Behavior
VWAP resets at market open because it calculates from scratch each session. This behavior differs fundamentally from moving averages, which carry historical data forward indefinitely. The reset creates a fresh reference point each morning.
At market open, VWAP starts at the first traded price and builds throughout the session. During the first thirty to sixty minutes, VWAP moves significantly as the market establishes its range for the day. After the first hour, VWAP stabilizes as volume distributes more evenly across the session.
This intraday behavior shapes how traders use VWAP. Early in the session, VWAP acts more like a running average—it changes rapidly and reflects immediate price action. Later in the session, VWAP becomes more stable and functions as an established reference level. Traders who use VWAP for support and resistance look for bounces off the line after the first hour, when the level has “set.”
The reset also means VWAP carries no information from prior days. A fifty-day moving average incorporates two and a half months of data. VWAP knows only today’s trading. This distinction explains why moving averages work for longer-term analysis while VWAP remains primarily an intraday tool.
Volume-Weighted Support and Resistance Levels
VWAP creates natural support and resistance levels because institutional activity clusters around it. When price drops below VWAP, buyers who missed earlier opportunities may step in, viewing the pullback as a discount to the day’s average price. When price rises above VWAP, sellers may emerge, viewing the rally as an opportunity to distribute.
The strength of VWAP as support or resistance depends on how price approached it. A clean bounce off VWAP on high volume indicates strong institutional interest at that level. A weak approach with declining volume suggests the level may not hold.
TradingView users can enhance VWAP analysis by adding standard deviation bands. These bands—typically set at one and two standard deviations above and below VWAP—create dynamic resistance and support levels. Price often reverses at the first standard deviation band. The second band marks extreme overbought or oversold conditions.
This volume-weighted framework helps traders identify high-probability entries. A long setup forms when price bounces off VWAP with increasing volume. A short setup forms when price rejects off VWAP with declining volume on the rally.
Multiple Timeframe Analysis with VWAP and EMAs
Multiple timeframe analysis combines signals from different chart intervals to confirm trade direction. A setup that looks bullish on a five-minute chart may appear bearish on an hourly chart. Trading with alignment across timeframes improves win rates.
The process works like this. Identify the trend on a higher timeframe using EMAs. On a sixty-minute chart, if the fifty-period EMA sits above the two hundred-period EMA, the trend is bullish. Switch to a fifteen-minute chart for entry timing. Look for price to retrace to VWAP or a moving average bounce before entering long.
The key is hierarchical alignment. Higher timeframes determine direction. Lower timeframes determine entry. Never take a long signal on a five-minute chart when the hourly EMA trend is bearish. The lower-timeframe setup may produce a winner occasionally, but the odds favor the higher-timeframe direction.
TradingView supports this workflow with multiple chart windows. Open the same symbol in multiple tabs with different intervals. Reference the higher timeframe for direction, execute on the lower timeframe.
Intraday Momentum Confirmation Using Indicator Alignment
Indicator alignment occurs when multiple indicators point in the same direction. A bullish alignment might include price above VWAP, price above the fifty-period EMA, the nine-period EMA above the twenty-one-period EMA, and increasing volume. When all these conditions hold, momentum supports the trade.
The alignment concept extends beyond simple direction. Traders also look for convergence—multiple indicators reaching the same conclusion from different perspectives. VWAP represents volume-weighted price. EMAs represent smoothed price momentum. Volume represents actual transaction activity. When all three agree, the signal is stronger than any single indicator alone.
Practical application requires defining your alignment criteria before the trading day begins. Write down which conditions must hold for a long entry and which must hold for a short entry. This mechanical approach removes emotion from the decision process. You either take the trade when alignment occurs or you wait.
TradingView’s pine script allows you to automate alignment detection, but most traders find it sufficient to visually verify the conditions. The discipline comes from waiting for alignment rather than forcing trades when only one or two indicators confirm.
Step 1 — Set Up Your TradingView Chart
Open TradingView and select the symbol you want to trade. Choose your primary intraday timeframe—five minutes works well for most day traders. Add VWAP by typing “VWAP” in the indicators search bar and selecting it. Add two moving averages: one exponential with a nine-period setting and one exponential with a twenty-one-period setting. Label them clearly so you can distinguish them on the chart.
Configure your chart to show volume at the bottom. Volume is essential for confirming VWAP bounces and validating moving average crossovers. Without volume confirmation, you’re trading on price action alone, which increases your vulnerability to false breakouts.
Save this chart layout as a template. TradingView allows you to save multiple chart layouts, so create one for each market condition you trade. The setup remains consistent, but you may adjust periods for different volatility regimes.
Step 2 — Identify the Trend Direction on a Higher Timeframe
Switch to a sixty-minute chart of the same symbol. Add a fifty-period EMA and a two hundred-period EMA. Determine trend direction by observing which EMA sits above the other. When the fifty sits above the two hundred, the trend is bullish. When the fifty sits below, the trend is bearish.
This step takes approximately thirty seconds but prevents the most common day trading mistake—trading against the trend. Many traders see a setup on their five-minute chart and enter without checking the higher timeframe. They get caught in reversals that the higher timeframe predicted.
Record the trend direction before returning to your intraday chart. Write “bullish” or “bearish” somewhere visible. This reference point guides all subsequent decisions.
Step 3 — Execute Trades When Alignment Occurs
Return to your five-minute chart and wait for entry conditions. For a long entry, require all of the following: the higher timeframe trend is bullish, price trades above VWAP, price retraces to find support at or near VWAP or the fifty-period SMA, the nine-period EMA crosses above the twenty-one-period EMA, and volume increases on the bounce.
For a short entry, require the mirror conditions: the higher timeframe trend is bearish, price trades below VWAP, price retraces to find resistance at or near VWAP or the fifty-period SMA, the nine-period EMA crosses below the twenty-one-period EMA, and volume increases on the rejection.
Enter on the bar following the crossover confirmation. Place your stop loss below the recent swing low for longs or above the recent swing high for shorts. Size your position so that a stop loss of one to two percent of your account capital represents the maximum loss.
Practical Tips for Better Results
- Use VWAP as your primary reference during the first ninety minutes of the session, when it reflects the market’s opening range and institutional positioning. Moving averages are more reliable after the opening volatility settles.
- When VWAP and a moving average level coincide, that level gains significance. A fifty-period SMA sitting near VWAP creates a confluence zone where price is more likely to bounce. Mark these zones on your chart.
- In strong trending markets, price often respects VWAP as a trend-following line—it bounces repeatedly in the direction of the trend. In ranging markets, VWAP flattens and price crosses it repeatedly without establishing direction. Adjust your strategy to the market regime.
- The nine and twenty-one EMA combination produces frequent crossovers on lower timeframes. If you’re getting whipsawed, switch to a fifteen-minute chart or increase the periods to twelve and twenty-six.
- Volume confirmation is non-negotiable. A bounce off VWAP on declining volume is likely to fail. Wait for expanding volume on the bounce or rejection before entering.
- VWAP’s standard deviation bands work as dynamic profit targets. Consider taking partial profits when price reaches the first standard deviation band in trending markets.
- Backtest your specific combination before trading it live. Record fifty trades on a demo account using your exact criteria. Analyze the win rate and average win versus average loss before risking real capital.
Common Mistakes to Avoid
- Overlapping too many moving averages creates visual clutter and decision paralysis. Stick to two or three. If you can’t read your chart in three seconds, you have too many indicators.
- Ignoring the higher timeframe trend is the fastest way to accumulate losses. A perfect five-minute setup fails more often than not when the hourly trend opposes it.
- Trading VWAP crossovers as entry signals causes confusion because VWAP is not a crossover indicator—it is a reference level. Use crossovers for moving averages; use VWAP for support and resistance.
- Setting forget-and-forget orders at VWAP without watching price approach the level invites slippage and poor execution. Be present for your trades.
- Using the same period settings across all markets ignores differences in volatility and average true range. NASDAQ stocks may need shorter periods; lower-volume tickers may need longer ones.
- Chasing price that has already moved significantly from VWAP in the direction of the trend creates late entries with poor risk-reward. Wait for retracements rather than chasing.
How do I add VWAP to TradingView charts?
Click the “Indicators” button at the top of your TradingView chart. Type “VWAP” in the search field. Select “VWAP” from the results. The indicator appears immediately on your chart, calculated from the current session. You can access additional options by clicking the gear icon next to the indicator name.
What is the difference between VWAP and a moving average?
VWAP weights price by volume, emphasizing levels where more trading occurred. Moving averages treat all price equally, smoothing price over time. VWAP resets each session; moving averages carry historical data forward. VWAP answers “where has volume concentrated today?” while moving averages answer “what is the general price trend?”
Which is better for day trading, VWAP or moving averages?
Neither is universally better. VWAP excels at identifying intraday support and resistance levels, especially during the first half of the trading session. Moving averages excel at identifying trend direction and generating mechanical entry signals through crossovers. Most successful day traders use both, applying each for its strength.
Why does VWAP reset at market open?
VWAP resets because it is designed as an intraday indicator. The calculation tracks only the current session’s activity, making it irrelevant for prior days. This reset provides a fresh reference point each morning and aligns VWAP with institutional trading goals—measuring execution quality against the day’s average price.
Can I use VWAP and moving averages together?
Yes, and most traders find this combination more effective than using either alone. VWAP provides reference levels. Moving averages provide trend direction and entry timing. Using them together creates a system where you trade with the trend confirmed by both price structure (VWAP) and momentum (EMAs).
Is VWAP more accurate than EMA for intraday trades?
Neither is more accurate—they measure different things. VWAP reflects volume-weighted average price, making it useful for execution quality and identifying where institutions have traded. EMA reflects smoothed price momentum, making it useful for trend following. Accuracy depends on using the right tool for the specific question you’re asking.
Conclusion
The distinction between VWAP and moving averages resolves into a simple principle: VWAP tells you where the volume has been, and moving averages tell you where the price is going. Use VWAP as a level—a potential support or resistance zone where price may react. Use moving averages as a direction indicator—a way to confirm whether the trend supports your trade.
Apply the step-by-step framework in this guide: set up your chart, check the higher timeframe trend, and wait for alignment before entering. The combination of VWAP moving averages on TradingView gives you a structured approach to intraday trading that balances volume analysis with momentum confirmation.
Remember that no indicator guarantees profits. Markets change. Volatility regimes shift. The setup that worked yesterday may produce losses today. Protect your capital with position sizing, stop losses, and the discipline to wait for alignment rather than forcing trades.
Start with the chart setup described here. Test it on a demo account. Track your results. Refine the criteria based on what you observe. The process takes time, but the structure keeps you focused on what matters—making decisions based on evidence, not emotion.
—
This article is for educational purposes only and does not constitute investment advice. Trading and investing carry risk of loss; never invest more than you can afford to lose.
Last reviewed: August 2026