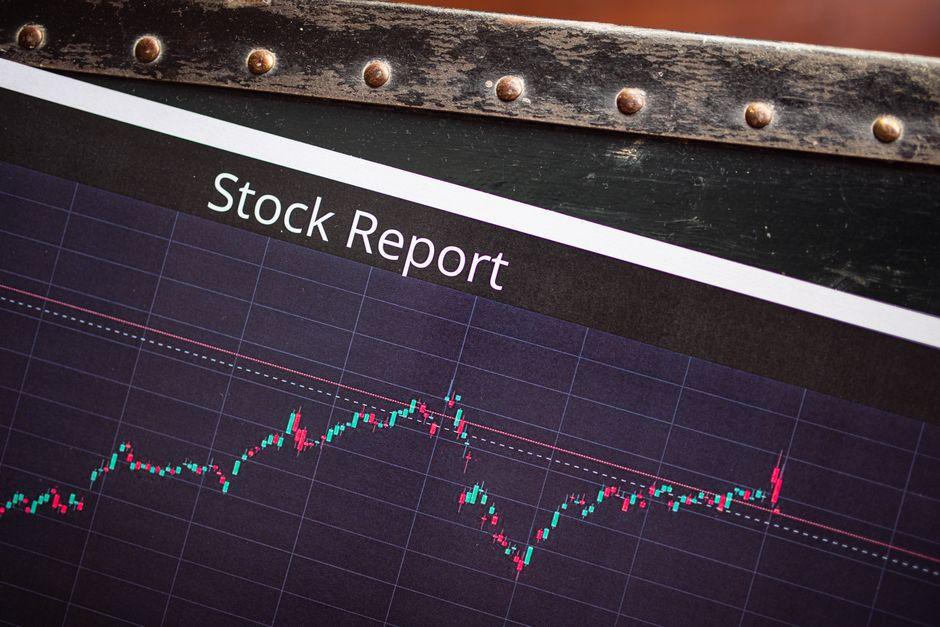
US Stock Market Analysis: A Practical Guide for Investors

Table of Contents
- Introduction
- What Is Stock Market Analysis
- Why Stock Market Analysis Matters for Traders and Investors
- Core Concepts
- Step-by-Step Guide
- Practical Tips for Better Results
- Common Mistakes to Avoid
- Frequently Asked Questions
- Conclusion
Introduction
The stock market sits at the center of this guide, and understanding it changes how traders approach the market.
The S&P 500 just closed its worst quarter in three years. Volatility has spiked, headlines are screaming recession, and your portfolio is down 15%. You’re wondering whether to sell, hold, or buy more. Every investor faces this moment—the gap between market noise and informed decision-making.
Stock market analysis closes that gap. It gives you a framework to evaluate prices, assess value, and time entries with discipline rather than emotion. Whether you’re managing a retirement account or trading options on tech stocks, the analytical tools in this guide work across timeframes and risk tolerances.
This article walks through the two main schools of analysis—technical and fundamental—shows you how to combine them, and gives you a step-by-step framework to apply immediately. You’ll learn to read charts like a professional, value companies using standard metrics, and recognize market sentiment before it turns.
What Is Stock Market Analysis?
Stock market analysis is the systematic process of evaluating individual securities and the broader market to make informed investment decisions. It involves studying price movements, company financials, economic conditions, and investor behavior to identify opportunities with favorable risk-reward profiles.
The process breaks into two primary disciplines. Technical analysis examines price charts and trading volume to predict future price movements based on historical patterns. Fundamental analysis digs into financial statements, competitive positioning, and economic factors to determine a company’s intrinsic value.
Consider a practical scenario. You’re evaluating Apple Inc. before an earnings release. Using technical analysis, you notice the 50-day moving average crossed above the 200-day moving average—a bullish signal called a golden cross. Simultaneously, you check the P/E ratio against the technology sector average. If Apple’s P/E sits at 28 while the sector trades at 22, you assess whether the premium is justified by growth prospects. Both perspectives inform your decision, but neither guarantees the outcome.
Why Stock Market Analysis Matters for Traders and Investors
Without analysis, you’re gambling. With analysis, you’re making calculated decisions. The difference shows up in consistency over time.
For day traders and short-term investors, analysis provides entry and exit triggers. A trader watching the VIX spike above 30 knows implied volatility is elevated and may adjust position sizing accordingly. Someone relying on gut feeling during volatile markets tends to chase prices and accumulate losses.
For long-term investors, analysis prevents costly behavioral mistakes. The Federal Reserve’s interest rate decisions, corporate earnings cycles, and sector performance patterns all influence portfolio returns. Ignoring these factors means missing opportunities to rebalance into strength and out of weakness.
Consider the 2022 bear market. Investors who used technical analysis to identify the breakdown below key support levels avoided significant drawdowns. Those who relied solely on “buy and hold” narratives saw portfolios decline 25% or more. Analysis doesn’t predict the future perfectly, but it improves odds significantly.
Core Concepts
Technical Analysis Using Moving Averages and RSI
Moving averages smooth price data to reveal trends. The 50-day moving average captures medium-term momentum; the 200-day moving average signals long-term trend direction. When the 50-day crosses above the 200-day, traders view it as bullish. The opposite—a death cross—signals weakness.
The Relative Strength Index (RSI) measures momentum on a 0-100 scale. RSI above 70 suggests overbought conditions; below 30 indicates oversold. These levels don’t guarantee reversals, but they highlight where other buyers might step in or where momentum is fading.
Imagine a blue-chip stock trading near $42 with strong fundamentals. You notice RSI dropped to 28—the oversold zone—while price holds at a prior support level from six months ago. This confluence creates a high-probability entry setup. The technicals align with value, and you’re buying when others are fearful.
Fundamental Analysis with P/E Ratios and Earnings Growth
The price-to-earnings ratio measures what investors pay per dollar of company earnings. A P/E of 20 means you’re paying $20 for $1 of annual earnings. Comparing P/E across sectors matters—tech stocks typically trade at higher multiples than utilities because growth expectations differ.
Earnings growth tells you whether a company is expanding profits over time. A company growing earnings at 15% annually can justify a higher P/E than one growing at 3%. The key is comparing like to like: a cyclical company’s current P/E may look cheap during a peak but expensive during a downturn.
When analyzing a company, compare its P/E to the sector average, not the broader market. A P/E of 25 in the technology sector might be cheap if peers trade at 35. The same P/E in a utility would be expensive. Context determines value.
Market Sentiment Indicators and Fear/Greed Index
Market sentiment reflects overall investor psychology—optimism or pessimism driving prices. Extreme greed pushes prices to unsustainable levels; extreme fear creates buying opportunities.
The CNN Fear & Greed Index aggregates seven indicators: stock price momentum, stock price strength, stock price breadth, put/call ratios, market volatility, safe haven demand, and junk bond demand. Readings above 75 signal extreme greed; below 25 indicate extreme fear.
Experienced investors use contrary logic. When the fear reading drops below 25, many quality stocks trade below intrinsic value simply because sellers are panicking. Conversely, greed readings above 75 often precede corrections because prices have outrun fundamentals. Sentiment works best as a timing tool for entries, not a standalone signal.
Sector Rotation Analysis Across Market Cycles
Different sectors outperform at different economic stages. During early expansion, technology and consumer discretionary stocks typically lead. During late expansion, utilities and consumer staples strengthen. During recessions, defensive sectors like healthcare hold up better than cyclicals.
Relative strength analysis identifies which sectors are outperforming the S&P 500. If technology is up 10% while the S&P is flat, technology shows positive relative strength. Monitoring these shifts helps you position ahead of trend changes.
Picture early recession signals appearing: yield curve inversion, falling manufacturing data, weakening consumer spending. An investor using sector rotation analysis would reduce technology exposure and shift toward healthcare and utilities. The goal is reducing correlation to the broader market decline while maintaining quality holdings.
Support and Resistance Level Identification
Support levels are price points where buying historically exceeds selling, preventing further declines. Resistance levels are where selling pressure overcomes buying, capping advances. These levels emerge from collective memory—traders remember where prices reversed before and react similarly.
Drawing support and resistance requires looking at prior price reaction points. A horizontal level where price bounced three times carries more weight than a one-time reversal. The more times a level holds, the more significant it becomes.
When a stock falls to $50—where it bounced twice in the past—that level becomes a reference point for entries or stop placement. If price breaks below $50 on increased volume, the prior support becomes resistance, and the technical thesis invalidates.
Volume-Weighted Average Price (VWAP) Analysis
VWAP calculates the average price traded throughout the day, weighted by volume. It acts as a fair value benchmark—institutional buyers use it to assess whether they’re paying above or below the day’s average price.
Traders watch VWAP for intraday bias. Trading above VWAP suggests strength; below suggests weakness. A stock breaking above VWAP on rising volume often continues higher. Conversely, failing at VWAP resistance can trigger short positions.
For longer-term investors, VWAP on daily charts identifies trend quality. A stock consistently trading above its daily VWAP over weeks shows strong institutional buying. This persistence often precedes significant moves as the accumulation continues.
Step-by-Step Guide
Step 1 — Define Your Timeframe and Objective
Before analyzing, clarify what you’re trying to accomplish. A retirement investor holding for decades has different needs than a trader looking for intraday swings. Your timeframe determines which indicators matter and how you’ll manage risk.
Write down your objective: “I want to identify undervalued large-cap stocks with strong earnings growth for a 3-5 year hold.” This clarity shapes every subsequent decision. Without it, you’ll chase conflicting signals and second-guess every trade.
Step 2 — Conduct Fundamental Screening
Start with quantitative screens to narrow your universe. Focus on companies meeting minimum criteria: positive earnings growth over five years, P/E within 20% of sector average (not dramatically over or under), and debt levels manageable relative to equity. The S&P 500 constituents or major ETFs like SPY provide good starting lists.
After screening, read the most recent quarterly earnings report and management guidance. Focus on revenue growth, profit margins, and forward expectations. You’re looking for companies executing well and guiding higher, not ones with declining trends.
Step 3 — Apply Technical Confirmation
With a fundamental shortlist, apply technical analysis to time your entry. Check the trend using the 200-day moving average. Above indicates long-term strength; below suggests caution.
Next, look for key support levels. Identify where the stock has bounced previously and mark those prices. Check RSI for overbought or oversold conditions. Your goal is entering during pullbacks to support in an uptrending stock—not chasing momentum at new highs.
Finally, set your stop-loss below the nearest support level. Never enter a position without knowing where you’ll exit if the thesis fails. A typical stop sits 5-8% below your entry for large-cap stocks, tighter for volatile names.
Practical Tips for Better Results
- Combine multiple analytical approaches rather than relying on one indicator. A stock with strong fundamentals AND bullish technicals offers higher probability than either alone.
- Size positions appropriately based on conviction and risk. A high-confidence setup with clear support justifies a larger position than a marginal setup near resistance.
- Review your analysis after the trade. Did the technicals work? Was the fundamental thesis correct? Tracking your hit rate reveals which methods produce results in your approach.
- Use limit orders instead of market orders, especially for illiquid stocks. You’ll avoid slippage that erodes returns silently.
- Track market breadth alongside price. The S&P 500 making new highs while equal-weight components lag signals weakening internals—often a warning ahead of actual declines.
- Keep an economic calendar. Federal Reserve meetings, CPI releases, and major earnings seasons create volatility windows that affect all stocks. Awareness helps you size positions appropriately around these events.
Common Mistakes to Avoid
- Analyzing without defining a timeframe first. Mixing long-term and short-term signals leads to contradictory conclusions and paralysis.
- Ignoring sector context when evaluating P/E ratios. A P/E of 40 is expensive in utilities but normal in technology.
- Setting stops too tight and getting stopped out by normal volatility. Large-cap stocks swing 2-4% daily during volatile periods—stops set at 3% will trigger frequently.
- Chasing stocks at new highs without waiting for pullbacks. FOMO entries consistently underperform patient entries to support levels.
- Overcomplicating with too many indicators. Three to five tools used consistently beat twelve tools used inconsistently. Simplify your process.
- Confirmation bias—only seeing data that supports your existing view. Actively seek information that might prove you wrong before entering a position.
Frequently Asked Questions
How do I analyze stock market trends for beginners?
Start with the 200-day moving average on a daily chart of the S&P 500. When price trades above this line, the trend is bullish. Below suggests bearish conditions. Next, learn to identify higher highs and higher lows for uptrends, lower highs and lower lows for downtrends. Combine this basic trend analysis with sector performance—checking which sectors lead and lag—to understand the broader market environment before analyzing individual stocks.
What are the best indicators for stock market analysis?
No single indicator works perfectly in isolation. The 50 and 200-day moving averages identify trend direction. RSI signals overbought and oversold conditions. VWAP provides intraday fair value reference. Volume confirms whether moves are legitimate or just noise. Using three to five indicators consistently produces better results than constantly switching between dozens. The best indicator is whatever you understand deeply enough to apply with discipline.
How do I read stock charts like a professional?
Professional chart reading starts with timeframe hierarchy—analyzing from larger to smaller frames. Look at the monthly chart for the long-term trend, weekly for intermediate structure, and daily or intraday for entry timing. Identify key support and resistance levels first, then look for price patterns like breakouts or reversals at those levels. Finally, confirm with volume and momentum indicators. Reading charts is pattern recognition that improves with practice, not secret knowledge.
What is the difference between fundamental and technical analysis?
Fundamental analysis determines whether a company is worth owning by examining financials—earnings, revenue, debt, growth rates, and competitive position. It answers “what should this stock be worth?” Technical analysis examines price and volume patterns to predict where price goes next. It answers “what is the stock doing right now?” Professional investors use both: fundamentals to decide what to own, technicals to decide when to buy it.
How often should I analyze my stock portfolio?
For long-term investors, monthly portfolio review suffices unless major market events occur. Weekly analysis of individual positions helps you stay informed without overreacting to daily noise. For active traders, daily analysis is necessary, but avoid making changes based on every fluctuation. Quarterly rebalancing aligns with earnings seasons and gives positions time to work while maintaining strategic oversight.
Can stock market analysis predict future prices accurately?
No analytical method predicts future prices with certainty. Analysis improves probability—it doesn’t guarantee outcomes. The goal is making informed decisions where your upside outweighs your downside over many trades. Even professional investors with sophisticated tools are right roughly 50-60% of the time. What matters is risk management: limiting losses on wrong bets so winners compound over time. Analysis is a tool for tilting odds in your favor, not a crystal ball.
Conclusion
Stock market analysis isn’t about predicting the future with certainty—it’s about making informed decisions with favorable odds. The frameworks in this guide work because they combine multiple perspectives: fundamentals identify what to own, technicals identify when to buy, and sentiment helps you avoid extremes.
Start with one or two methods. Master moving average trends and P/E comparisons before adding complexity. Build your process gradually, track your results, and refine what works.
The next time the market drops sharply, you’ll have a framework to evaluate whether it’s a buying opportunity or a warning sign. That’s the real value of analysis—not certainty, but the confidence to act based on evidence rather than emotion.
Remember: no analysis guarantees profits. Markets can remain irrational longer than you can remain solvent. Always use position sizing and stop-losses to manage risk. Never invest more than you can afford to lose.
—
This article is for educational purposes only and does not constitute investment advice. Trading and investing carry risk of loss; never invest more than you can afford to lose.
Last reviewed: August 2026