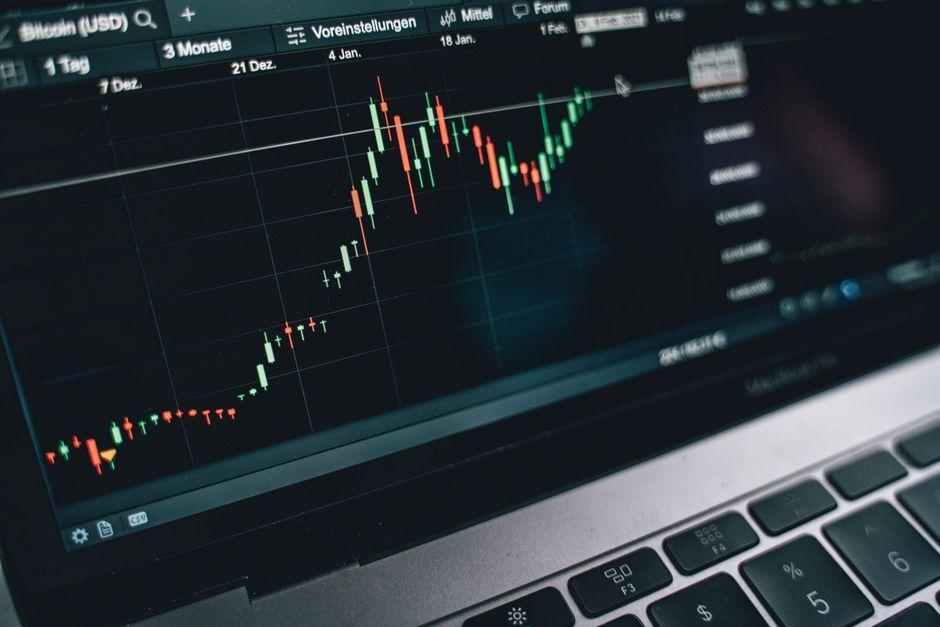
Spot Trading vs Futures Trading: Support and Resistance Guide

Table of Contents
- Introduction
- What Is Spot Trading and How Does It Differ from Futures?
- Why Support and Resistance Strategies Matter Differently in Each Market
- Core Concepts
- Step-by-Step Guide
- Practical Tips for Better Results
- Common Mistakes to Avoid
- Frequently Asked Questions
- Conclusion
Introduction
You identify a clear resistance level at Bitcoin $42,000. The price has tested this zone three times over the past month, and volume clustering confirms strong seller interest at this level. Now comes the critical decision: do you execute this trade in the spot market or the futures market?
The answer matters enormously. A spot trader and a futures trader looking at identical charts face fundamentally different risk profiles, execution mechanics, and behavioral pressures. Support and resistance levels behave differently when leverage enters the equation. Funding rate cycles create subtle price distortions near key levels in futures markets that spot traders never experience. Understanding these differences is not academic—it directly impacts whether your technical analysis thesis plays out profitably or blows up your account.
This guide breaks down exactly how support and resistance strategies work in spot trading versus futures trading. You’ll learn the mechanics that create these differences, see concrete trade examples, and gain a framework for choosing the right instrument for your analysis approach.
What Is Spot Trading and How Does It Differ from Futures?
Spot trading involves buying or selling an asset for immediate delivery and settlement. When you trade spot, you own the actual asset—your balance reflects real holdings that you can withdraw, transfer, or hold indefinitely. The trade executes at the current market price, and your P&L moves with the asset’s price in real-time.
Futures trading, by contrast, involves contracts that obligate the buyer or seller to execute a transaction at a predetermined price on a future date. You never own the underlying asset. Instead, you hold a derivative position whose value derives from the underlying asset’s price. Most retail traders in crypto and forex use perpetual futures, which have no expiration date but carry funding payments that adjust the contract price to track the underlying spot price.
The mechanical differences create divergent trading dynamics. In spot trading, your maximum loss is the capital deployed—you cannot lose more than you put in. In futures trading with leverage, your position can be liquidated, meaning you lose your entire margin deposit even if the market subsequently reverses. The spot trader waiting at a support level faces a different psychological landscape than the leveraged futures trader watching liquidation prices approach.
Why Support and Resistance Strategies Matter Differently in Each Market
Support and resistance levels represent price zones where historical buying or selling pressure has created reversible price reactions. These levels work because market participants remember them. Traders place orders at these zones, and algorithmic systems are programmed to react to them. The mechanics are identical in theory, but the execution realities diverge significantly.
In spot markets, support and resistance levels function as pure price memory. A level that held multiple times in the past has demonstrated buyer or seller conviction. When price returns to that zone, you can reasonably expect similar dynamics. The spot trader can place limit orders below resistance or above support and wait with reasonable confidence that the market will react to the level.
In futures markets, the same levels exist, but leverage distorts the probability calculations. A support level that would be perfectly adequate for a spot position becomes dangerous when you’re trading with 10x or 20x leverage. The same price swing that represents a 2% pullback in spot terms becomes a 20% or 40% drawdown on a leveraged position. Support and resistance still work, but the risk-reward equation shifts fundamentally.
Also, futures markets have unique dynamics that affect how price behaves around key levels. Funding rate imbalances can push perpetual contracts away from spot prices, creating apparent support or resistance zones that are actually artifacts of funding pressure rather than genuine supply-demand zones.
Support and Resistance Level Validation Through Volume Clustering
Volume clustering confirms whether a price level represents genuine support or resistance rather than random price noise. When price approaches a key level, you should examine whether trading volume concentrates at that price zone. A level that held with high volume on multiple tests demonstrates institutional participation—it is not merely a round number or psychological barrier that retail traders are reacting to.
In spot markets, volume clustering provides high-confidence signals. You can review historical volume data at specific price levels and determine whether the level has genuine memory. A spot trader identifying Bitcoin $42,000 as resistance would want to see that sellers entered aggressively every time price approached this zone, with volume spikes confirming the conviction.
In futures markets, volume analysis requires additional context. You must distinguish between volume at the futures contract level and underlying spot market activity. Sometimes a level appears strong in futures due to massive leveraged positioning, but the underlying spot market shows no such conviction. This divergence creates opportunities—but only if you understand which market’s volume actually matters for your thesis.
Consider a scenario where Bitcoin approaches $42,000 on spot exchanges with moderate volume, but the futures market shows massive volume spikes at this level. The futures volume likely reflects leveraged speculation rather than genuine spot demand. If you enter a spot position based on futures volume signals, you may be trading on a false premise.
Leverage Amplification of Support and Resistance Breakouts in Futures
Leverage fundamentally changes how support and resistance breakouts function. In spot trading, a breakout above resistance simply means the price has moved to new territory. Your position’s P&L changes by the exact amount the price moves. If you bought at $41,500 and price breaks out above $42,000, you earn approximately 1.2% for every dollar move above your entry.
In futures with 10x leverage, that same 1.2% move becomes a 12% gain on your margin. The amplification works perfectly in your favor when the breakout succeeds. When it fails, the same math works against you. A 1.2% false breakout—a common occurrence in markets—wipes out 12% of your margin at 10x leverage. Two such failures in succession can eliminate your position entirely.
The practical implication is severe: support and resistance levels that are perfectly valid for spot traders become dangerous traps for leveraged futures traders. A level that holds 70% of the time in spot markets may only hold 60% of the time when you’re trading with leverage, because the 10% of trades that go against you with leverage result in liquidation before the price has a chance to recover.
A concrete example illustrates this. A futures trader identifies Bitcoin support near $40,500, a level that has held three times over the past two months. Using 10x leverage, they enter a long position with a stop-loss at $40,200—seemingly reasonable given that the level has held before. The market briefly dips below $40,500, triggers the stop, and the trader exits with a loss. Price then rebounds to $41,000. The support level worked exactly as expected in spot terms, but the leveraged trader lost money because their stop was too tight for the leverage environment.
Funding Rate Cycles and Their Impact on Futures Price Action Near Key Levels
Perpetual futures contracts use funding rates to keep the contract price aligned with the spot price. When funding is positive, long positions pay short positions. When funding is negative, shorts pay longs. These payments occur every eight hours in most crypto exchanges, creating systematic pressure points in the market.
Near key support or resistance levels, funding rate dynamics can override natural price action. When funding is heavily positive—meaning most traders are long—short-term sellers have an incentive to push price down to force longs to panic-sell before the funding payment. Conversely, when funding is heavily negative, short-squeeze dynamics can push price above natural resistance as short positions are forced to cover.
A spot trader watching a resistance level at $42,000 can reasonably predict price reaction based purely on historical support and resistance behavior. A futures trader must also consider funding regime. If funding is heavily positive and price approaches resistance, the probability of a rejection increases—not because the resistance level is stronger, but because the funding incentive creates temporary selling pressure.
Over typical market cycles, funding rates oscillate between positive and negative regimes. During strong uptrends, funding stays consistently positive as everyone wants to be long. During pullbacks, funding turns negative as short positions accumulate. These cycles create predictable patterns near support and resistance that sophisticated futures traders can exploit—but that spot traders should be aware of to avoid confusion when futures price action diverges from spot.
Step 1 — Assess Your Risk Tolerance and Account Structure
Before choosing between spot and futures, honestly evaluate your risk tolerance and account size. Spot trading limits your loss to your initial capital—a $10,000 account can lose $10,000 maximum. Futures with leverage can lose more than your initial deposit if liquidation occurs. If you’re trading with retirement money or money you cannot afford to lose, spot trading’s defined risk profile is usually the appropriate choice.
Consider your psychological relationship with losses. Many traders believe they can handle leveraged losses until they experience the feeling of watching a position liquidate in minutes. If you’ve never traded with leverage, start with spot positions and add leverage only after you have proven your strategy works at base position sizes.
Step 2 — Validate the Support or Resistance Level Across Multiple Timeframes
Identify your key level on a higher timeframe chart first—daily or weekly—and then confirm it on lower timeframes. A level that appears on both weekly and daily charts carries more weight than one visible only on the hourly chart. This multi-timeframe validation works in both spot and futures markets, but the confidence level required differs.
For spot trades, a level validated on two timeframes with volume confirmation is usually sufficient. For leveraged futures trades, add an additional confirmation requirement. Consider waiting for a retest of the level after the initial touch, or require a catalyst (such as a news event or funding rate shift) that provides additional confidence the level will hold.
Step 3 — Adjust Position Sizing and Stop Placement for Your Chosen Market
Once you’ve decided spot or futures, adjust your execution parameters accordingly. For spot positions, calculate your position size so that a move to your stop-loss represents a loss you’re comfortable with—typically 1-2% of account value per trade. Place your stop slightly beyond the obvious technical level to account for temporary wicks.
For futures positions, calculate your position size based on liquidation price, not just dollar loss. A 10x leveraged position with a 2% stop from entry has a liquidation price roughly 8-9% below entry (exact calculation varies by exchange). Ensure this liquidation level is well beyond any major support zone. If the nearest support is 5% below your entry, do not enter with 10x leverage—your position will liquidate if price simply retests support.
Practical Tips for Better Results
- Use wider stops in futures markets to account for leverage-induced volatility. A level that deserves a 2% stop in spot may need 4-5% in futures to survive normal market noise.
- Check funding rates before entering futures positions near key levels. Positive funding near resistance increases rejection probability; negative funding near support increases bounce probability.
- Compare futures prices to spot prices before trading. Large basis (price divergence) often indicates positioning extremes that can lead to squeeze dynamics.
- Consider the regulatory environment. Spot trading on regulated exchanges provides clearer investor protections than many futures platforms.
- Track your win rate separately for spot versus futures trades. Most traders find their win rate drops with leveraged positions due to the mathematical amplification of small losses.
- Use spot positions to test support and resistance hypotheses before committing leveraged capital. If a level fails in spot, it will likely fail faster and more catastrophically in futures.
Common Mistakes to Avoid
- Applying spot-style stop losses to leveraged futures positions. This is the most common mistake and the most lethal. A 2% stop on a 10x leveraged position creates effective liquidation risk of approximately 8-9%, not 2%.
- Ignoring funding costs in futures position calculations. Over typical holding periods of one to two weeks, funding can eat into profits significantly, especially in volatile markets where rates swing substantially.
- Confusing futures volume with spot conviction. Massive futures volume at a resistance level may reflect speculative positioning rather than genuine seller conviction at spot.
- Trading the same position size in both markets. Your risk exposure differs fundamentally—adjust accordingly or you’re implicitly increasing risk when switching to futures.
- Chasing breakouts in leveraged futures after multiple tests of a level. The fifth or sixth test of a support or resistance zone often breaks, regardless of market type, and leveraged traders have no buffer to survive the breakout.
What is the difference between spot trading and futures trading?
Spot trading involves buying or selling an asset for immediate delivery, meaning you own the actual asset. Futures trading involves contracts that obligate parties to execute a transaction at a predetermined price on a future date, without actually owning the underlying asset. The key difference is ownership: spot traders hold assets, futures traders hold derivative positions that can be leveraged but also liquidated.
How do you trade support and resistance in spot markets?
In spot markets, you identify key price levels where price has previously reversed, validate them with volume data, and place limit orders slightly below support or slightly below resistance. Your stop-loss goes beyond the level to account for wicks, and your position size is calculated so that a full loss at the stop represents 1-2% of your account. The spot market’s defined risk profile allows for straightforward position sizing based on dollar risk.
Does leverage change how support and resistance works in futures?
Leverage fundamentally alters the risk-reward calculus of support and resistance. A level that holds 70% of the time in spot markets becomes unreliable at 10x leverage because the 30% failures result in liquidation before price can recover. Futures traders need wider stops, stronger confirmation, and smaller position sizes to account for the amplified volatility that leverage introduces.
Which is better for beginners: spot or futures trading?
Spot trading is generally better for beginners because the risk is defined and limited to capital deployed. Beginners should build competence and consistency in spot markets before introducing leverage. Learning to identify support and resistance, manage position size, and control emotions is difficult enough without the amplified pressure of leveraged liquidation risk.
Can I use the same support and resistance strategy for both markets?
The underlying technical analysis is identical—you’re looking at the same price charts. But the execution parameters must change. Position sizing, stop-loss placement, and confirmation requirements should all be more conservative in futures markets to account for leverage amplification. What works as a valid setup in spot may become a liquidation trap in futures.
What are the main risks of futures trading support and resistance breakouts?
The primary risk is liquidation from false breakouts. Support and resistance levels fail regularly in all markets, but spot traders survive these failures while leveraged futures traders may be wiped out. Additional risks include funding rate erosion during extended holds, basis risk if futures price diverges significantly from spot, and liquidity slippage during volatile breakout moments.
Conclusion
Support and resistance strategies transfer between spot and futures markets, but the execution requires fundamental adjustments. The same level that represents a high-probability setup in spot trading can become a liquidation trap in leveraged futures simply because the math of leverage changes the probability calculations. A 70% success rate at a support level works beautifully in spot and disastrously in futures if your position size and stop placement don’t account for leverage distortion.
Your first practical step is to track your support and resistance trades separately: note whether you executed in spot or futures, your leverage level, and the outcome. Over twenty to thirty trades, you’ll develop an intuitive sense for where the strategies diverge and where your personal performance differs. Most traders find they should default to spot trading for their primary thesis-testing positions and reserve leveraged futures for high-conviction setups where they’ve already proven the level works in spot.
Remember that no technical strategy eliminates risk. Support and resistance levels represent probability assessments, not certainties. In leveraged markets, the cost of being wrong increases dramatically. Trade according to your actual risk capacity, not your imagined tolerance for loss. The markets will test your convictions—the question is whether you’ll still be trading when the test comes.
—
This article is for educational purposes only and does not constitute investment advice. Trading and investing carry risk of loss; never invest more than you can afford to lose.
Last reviewed: August 2026