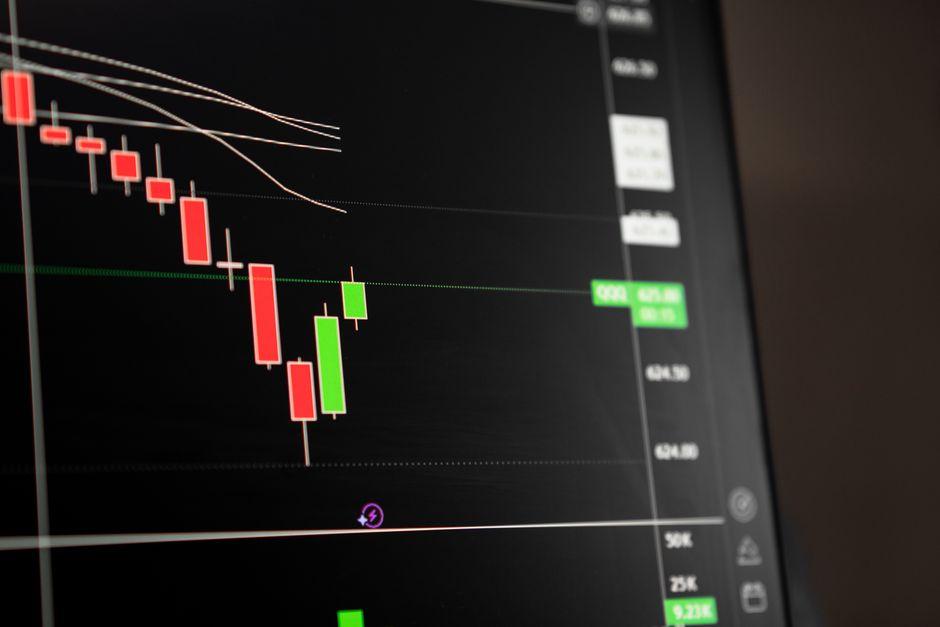
Market Analysis: How to Set Up Your Daily Trading Routine

Table of Contents
- Introduction
- What Is Market Analysis?
- Why Market Analysis Matters for Traders and Investors
- Core Concepts
- Step-by-Step Guide
- Practical Tips for Better Results
- Common Mistakes to Avoid
- Frequently Asked Questions
- Conclusion
Introduction
Imagine opening your trading terminal on a Tuesday morning to find the S&P 500 gapping down 1% while the VIX spikes. Most retail participants react with raw emotion, either panic-selling their long positions or rushing into a perceived cheap buy without understanding the catalyst behind the move. They are reacting to price action in a vacuum, rather than performing a comprehensive market analysis. This fundamental disconnect is where the majority of trading accounts are liquidated.
The distinction between a professional operator and a gambler lies in the routine. A professional does not guess the next tick; they construct a thesis based on a repeatable, mechanical process of market analysis. They identify the current market regime, locate where liquidity is resting, and wait for a specific catalyst to trigger their entry. Without a structured daily workflow, you are essentially guessing in a high-stakes environment where institutional liquidity—the house—typically holds the advantage.
This guide provides a rigorous framework to transform fragmented data into a high-performance routine. You will learn how to filter out the noise, map out your trading day, and ensure that every position you take is backed by a logical chain of evidence and a clear risk-to-reward profile.
What Is Market Analysis?
Market analysis is the systematic evaluation of financial data to determine the current state of an asset and estimate its probable future direction. It is not an exercise in prophecy, but rather a method of probability assessment. This process involves synthesizing technical data, such as price action and volume, with fundamental drivers like central bank policy and macroeconomic reports, and sentiment indicators that reveal market psychology and positioning.
For instance, a professional trader performing market analysis on the EUR/USD pair would not rely solely on a 15-minute chart. They would analyze the US Dollar Index (DXY) to gauge overall dollar strength, review the Federal Reserve’s latest meeting minutes for hawkish or dovish shifts, and identify where large clusters of limit orders are resting using a Volume Profile. By combining these layers, the trader moves from a guess to a high-probability thesis.
Why Market Analysis Matters for Traders and Investors
Professional trading is fundamentally an exercise in risk management. You cannot manage risk effectively if you do not understand the environment in which you are operating. Market analysis dictates which tool is appropriate for the current regime. In a strong trending market, mean-reversion strategies often lead to rapid, catastrophic drawdowns. Conversely, in a ranging or sideways market, trend-following signals frequently result in a series of small, frustrating losses known as whipsaws.
Ignoring a structured routine often leads to analysis paralysis or, on the opposite end, impulsive overtrading. When a disciplined routine is in place, the trader stops searching for trades and begins looking for the absence of their specific setup. This shift in perspective is what protects capital. By the time a trader clicks buy or sell, the analysis should be complete; the execution is simply the final step of a pre-determined plan.
Top-Down Analysis: Monthly to 15-Minute Charts
Top-down analysis prevents the common error of zooming in too far on a chart. When a trader focuses exclusively on a 5-minute timeframe, a minor rally can look like the start of a new bull market. However, when they zoom out to the Daily or Weekly charts, they may realize that the rally is actually a small retracement into a massive historical resistance zone.
In a professional workflow, a swing trader begins with the Monthly chart to identify the primary trend and long-term cycle. They then move to the Daily chart to establish key support and resistance levels. Finally, they drop to the 1-hour or 15-minute chart to refine their entry point and optimize their stop-loss placement. This ensures the trade is aligned with higher-timeframe momentum, which significantly increases the probability of a successful outcome.
Intermarket Analysis and Asset Correlation
No financial asset exists in a vacuum. Prices move based on the global flow of capital between different asset classes. Intermarket analysis involves monitoring correlated instruments to confirm a thesis. One of the most critical relationships for any global macro trader is the inverse correlation between the US Dollar and risk assets.
Consider a trader analyzing the EUR/USD. Before entering a long position, they would check the DXY. If the DXY is hitting a major resistance level and showing signs of reversal, it provides a high-probability confirmation that the EUR/USD has room to move higher. If the DXY is breaking out to new highs, longing the Euro is essentially fighting the strongest wind in the market, regardless of what the individual EUR/USD chart suggests.
Sentiment Analysis via Order Flow and Volume Profile
Price is the ultimate result of an imbalance between buyers and sellers. While a candlestick tells you where the price went, order flow and Volume Profile reveal where the actual business was conducted. Volume Profile identifies High Volume Nodes (HVNs), which act as magnets for price, and Low Volume Nodes (LVNs), where price tends to move through rapidly due to a lack of opposing orders.
For example, if the S&P 500 is approaching a Value Area High (VAH) and the order flow shows a massive influx of sell limit orders—known as aggressive absorption—the trader knows the rally is likely to stall. Instead of chasing the move, they look for a reversal pattern. This shifts the analysis from a subjective feeling that the price is too high to a data-driven observation that institutional selling is occurring at a precise level.
Fundamental Catalyst Mapping
Fundamentals provide the why behind the what. Technicals show the pattern, but catalysts provide the fuel for the move. Catalyst mapping involves identifying high-impact events that can invalidate technical levels in a matter of seconds. This includes central bank interest rate decisions from the ECB, IMF reports, and domestic data such as Non-Farm Payrolls (NFP) or CPI prints.
A practical scenario: a trader identifies a perfect bull flag pattern on Gold (XAU/USD). However, the economic calendar shows a Consumer Price Index (CPI) release in two hours. A professional trader knows that a CPI surprise can cause a 2% move in either direction, rendering the technical bull flag irrelevant. They will either remain flat until the news is released or significantly reduce their position size to account for the increased implied volatility.
Step-by-Step Guide
Step 1: The Pre-Market Macro Scan
The day must begin with a big-picture view before opening any specific asset charts. This prevents the trader from being blindsided by global events that override technical setups.
1. Check the Economic Calendar: Identify high-impact events, often referred to as Red Folder events. Note the exact time of release and the delta between the expected and previous values.
2. Review Overnight Action: Analyze the Asian and European sessions. Did the market gap? Where did the liquidity settle, and were there any significant overnight trends?
3. Assess the VIX: Check the CBOE Volatility Index. If the VIX is spiking, expect wider spreads, slippage, and more erratic price swings that may trigger stops prematurely.
4. Determine the Regime: Decide if the market is trending, ranging, or in a state of extreme volatility. This determines whether you use trend-following or mean-reversion tools.
Step 2: Technical Mapping and Level Identification
Once the macro context is established, move to the charts to define the battlefield.
1. Higher Timeframe (HTF) Analysis: Mark major support and resistance on the Daily and 4-hour charts. These are your zones of interest where price is likely to react.
2. Identify the Trend: Use market structure, such as higher highs and higher lows, to determine the current directional bias.
3. Map Liquidity: Locate equal highs or equal lows where stop-loss orders likely cluster. Price often hunts these liquidity pools before reversing direction.
4. Set Alerts: Instead of staring at the screen and succumbing to emotional fatigue, set alerts at key levels. This allows you to remain objective until the price reaches your zone.
Step 3: Execution Planning and Risk Parameter Setting
The final step is to create a mechanical if-then plan. This removes discretion and emotional impulse during the heat of the trade.
1. Define the Setup: Create a specific trigger. For example: If price retraces to the 0.618 Fibonacci level and prints a bullish engulfing candle on the 15-minute chart, I will enter.
2. Calculate Position Size: Determine your risk per trade as a percentage of account equity, such as 0.5% or 1%. Never guess your lot size or position volume.
3. Set the Stop Loss: Place your stop beyond the structural invalidation point. The stop should be placed where the trade thesis is proven wrong, not at a random number of pips.
4. Define the Target: Identify the next logical liquidity zone or resistance level. Ensure the risk-reward ratio is at least 1:2 to maintain a positive expectancy over time.
Practical Tips for Better Results
- Use a Trading Journal: Document not just the entry and exit, but the specific analysis that led to the trade. This allows you to identify patterns in your failures and refine your edge.
- Focus on a Few Assets: Specializing in two or three specific pairs or stocks allows you to develop an intuitive feel for their unique volatility and personality.
- Prioritize Liquidity over Patterns: A head and shoulders pattern in a low-liquidity environment is often a bull or bear trap. Always prioritize where the institutional money is sitting.
- Use a Checklist: Create a physical or digital checklist. If a trade does not check every box—Trend, Level, Catalyst, and Risk—you do not take the position.
- Time Your Analysis: Perform the heavy lifting of HTF analysis during low-volatility periods. When the market opens, you should be executing a pre-existing plan, not creating one on the fly.
- Monitor Correlation: If you are long on the S&P 500 and long on the Nasdaq, you are not diversified. You are simply doubling your exposure to the same systemic risk.
Common Mistakes to Avoid
- Revenge Trading: Attempting to win back a loss by ignoring your analysis and increasing position size. This emotional response usually leads to a total account wipeout.
- Over-Analysis: Adding too many indicators to a single chart. When you use ten different oscillators, you will always find one that tells you to buy and another that tells you to sell, leading to indecision.
- Ignoring the Calendar: Entering a high-leverage position minutes before a central bank announcement. The resulting slippage can push your loss far beyond your intended stop-loss.
- Confirmation Bias: Only seeking out news or chart patterns that support your existing bias. If you are bullish, you will naturally ignore bearish signals unless you consciously seek them out.
- Trading the Middle: Entering trades in the middle of a range. Professional market analysis focuses on the edges—the extremes where the risk-reward ratio is most favorable.
How long should a daily market analysis routine take?
For most professional day traders, a thorough routine takes between 45 and 90 minutes. This window covers the macro scan, technical mapping, and execution planning. If you spend four hours analyzing, you are likely over-analyzing and may miss the actual move or succumb to mental fatigue.
What is the difference between technical and fundamental market analysis?
Technical analysis focuses on price action, volume, and chart patterns to predict future movement based on historical behavior and psychology. Fundamental analysis examines the underlying drivers—such as interest rates, GDP, corporate earnings, and geopolitics—to determine the intrinsic or fair value of an asset.
Why is a pre-market routine important for day traders?
A routine removes the emotional component of trading. By deciding your entry and exit rules before the market opens, you avoid the FOMO (fear of missing out) that occurs when price starts moving rapidly, which often leads to chasing the market at the worst possible price.
When is the best time to perform market analysis?
The optimal time is during the quiet hours before the primary session you trade, such as the period before the New York open. This allows you to think clearly and objectively without the stress of ticking prices influencing your judgment.
Can beginners use automated tools for market analysis?
Beginners can use screeners and alerts to identify potential candidates, but they should not rely on black box signals or automated bots. Understanding the why behind a price move is the only way to develop a sustainable edge and long-term profitability.
Is market analysis more important than risk management?
No. Risk management is the most critical element of trading. Analysis tells you where to place the trade, but risk management determines whether you survive the trade. Even the most rigorous analysis can be wrong; risk management ensures that one wrong trade does not end your career.
Conclusion
The ultimate goal of a daily market analysis routine is to move from a state of reaction to a state of anticipation. By synthesizing top-down technicals, intermarket correlations, and fundamental catalysts, you create a filter that removes low-probability trades from your day. The most successful traders are not those who can predict the future with certainty, but those who possess a mechanical process for handling whatever the market delivers.
Your next step is to build a simple, non-negotiable checklist: Macro Scan $\rightarrow$ HTF Levels $\rightarrow$ Liquidity Mapping $\rightarrow$ Risk Calculation. Apply this framework to one single asset for the next ten trading days without deviation.
Trading involves significant risk of loss. No analysis method, regardless of how rigorous it is, can guarantee profits or eliminate the possibility of a drawdown. Always trade with capital you can afford to lose and adhere to strict risk management protocols to protect your equity.
*
Last reviewed: August 2026