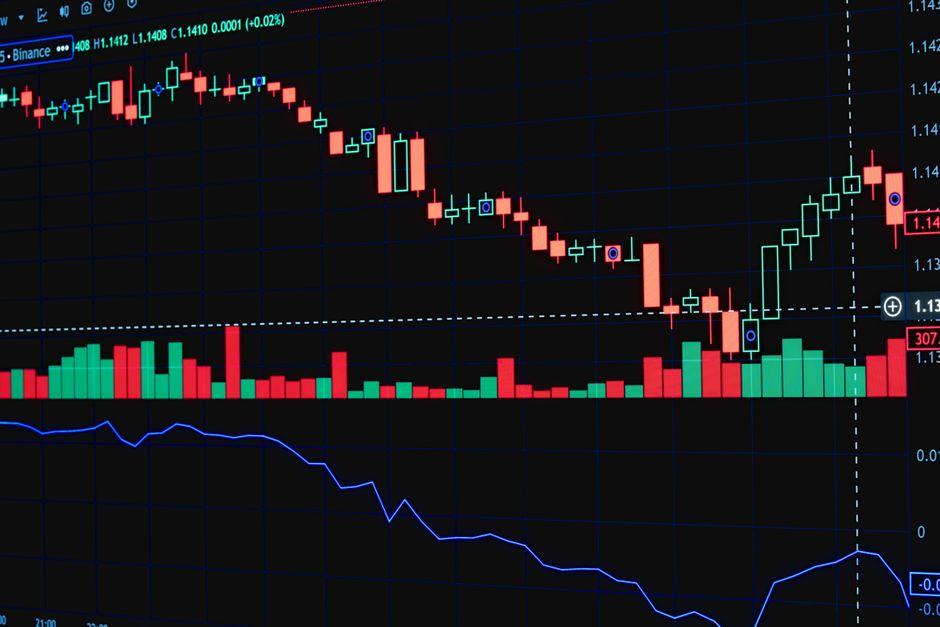
How to Trade SMT Divergence Between Nasdaq and S&P 500

Table of Contents
- Introduction
- What Is SMT Divergence Between Nasdaq and S&P 500
- Why SMT Divergence Matters for Traders and Investors
- Core Concepts
- Step-by-Step Guide
- Practical Tips for Better Results
- Common Mistakes to Avoid
- Frequently Asked Questions
- Conclusion
Introduction
When the Nasdaq’s technology‑heavy rally outpaced the broader S&P 500 in early March, the spread between the two benchmarks widened to a level not seen since the pandemic‑driven sell‑off of 2020. Smart‑Money Trackers (SMT) flagged a divergence that later coincided with a three‑day swing in QQQ futures, while SPY futures lagged behind. Many market participants missed the move because they examined each index in isolation rather than watching the inter‑market relationship that ties them together.
If you have ever wondered how to trade the subtle mis‑alignment between these two barometers, you are not alone. The Nasdaq–S&P 500 spread carries information about sector rotation, risk appetite, and hidden liquidity that a plain price chart cannot reveal. Overlooking it can leave a portfolio exposed to sudden reversals, especially when macro data shifts the risk premium.
This piece offers a data‑driven tutorial that walks you from calculating SMT divergence to executing futures and options spreads, complete with risk controls and real‑world case studies. The goal is to turn a nuanced signal into a repeatable edge, not a speculative gamble.
What Is SMT Divergence Between Nasdaq and S&P 500?
SMT divergence is a signal generated when a Smart Money Tracker—typically a composite of volume‑weighted price, order‑flow, and momentum metrics—produces opposite directional cues on two highly correlated instruments. In the Nasdaq–S&P 500 context, the tracker compares the relative strength of Nasdaq futures (or the QQQ ETF) against the S&P 500 futures (or the SPY ETF).
Example: On 12 April 2024, the SMT’s 10‑day exponential moving average (EMA) on the Nasdaq‑to‑S&P spread turned bullish while the spread itself widened from 0.8 % to 1.2 %. The indicator suggested that institutional buying was concentrating in Nasdaq‑linked tech stocks, creating a temporary imbalance ripe for a spread trade.
The divergence does not predict the direction of either index in isolation; instead, it highlights a relative‑value dislocation that can be harvested with a carefully structured position.
Why SMT Divergence Matters for Traders and Investors
Professional prop desks, hedge funds, and sophisticated retail traders use inter‑market divergence to capture relative value rather than a pure directional bet. The signal becomes valuable in three recurring scenarios:
1. Risk‑on / risk‑off pivots – When macro news—such as a Federal Reserve rate decision—tilts risk appetite, Nasdaq often reacts faster than the broader market. SMT divergence highlights the lag, allowing a trader to position ahead of the broader move.
2. Sector rotation – A surge in tech earnings can push Nasdaq higher while value‑heavy S&P sectors stay flat. Divergence points to a potential reallocation opportunity, especially when the rotation is supported by earnings surprises that move the Nasdaq’s earnings‑per‑share (EPS) growth outlook.
3. Liquidity squeezes – During thin‑volume periods, order flow concentrates on the more liquid Nasdaq contract, widening the spread. A divergence alert can serve as a proxy for an upcoming liquidity‑driven correction, similar to the way a sudden spike in the CBOE Volatility Index (VIX) often precedes a market pullback.
Ignoring the signal may result in missed profit opportunities or exposure to adverse moves when the spread reverts to its historical mean.
SMT Calculation on the Inter‑Market Spread
The SMT algorithm typically layers three inputs:
1. Volume‑weighted moving average of the price ratio (Nasdaq / S&P 500). This smooths raw price noise and reflects where the bulk of trading activity is occurring.
2. Order‑flow imbalance metric derived from CFTC Commitment of Traders (COT) data. The metric isolates net long versus short positions held by non‑commercial traders, who are often considered “smart money.”
3. Momentum oscillator such as the MACD histogram, which captures acceleration or deceleration in price movement.
The composite is then smoothed with a 10‑day EMA to reduce false triggers.
Concrete scenario: A trader monitors the SMT value on the QQQ/SPY price ratio. On 5 May 2023, the SMT fell 0.15 points while the spread widened, indicating that smart money was exiting Nasdaq relative to the S&P 500. The trader entered a short QQQ call spread and a long SPY put spread, profiting from the subsequent 1.5 % pullback in the Nasdaq‑to‑S&P ratio.
MACD Histogram Divergence Between Nasdaq Futures and S&P 500 Index
The MACD histogram measures the distance between the fast (12‑period) and slow (26‑period) exponential moving averages. A divergence occurs when the histogram makes higher lows while the underlying price makes lower lows, or vice‑versa.
Concrete scenario: On 22 July 2023, Nasdaq futures posted a lower low, but the MACD histogram formed a higher low, while the S&P 500’s histogram stayed flat. The trader interpreted this as a bullish divergence for Nasdaq relative to the S&P 500 and bought QQQ futures, hedging the position with a short SPY futures contract. The spread subsequently narrowed by 0.6 %, delivering a clean profit.
RSI Divergence on the Nasdaq‑S&P 500 Price Ratio
Relative Strength Index (RSI) divergence is identified when the RSI on the spread moves opposite to the spread itself. An overbought RSI (>70) on a narrowing spread can foreshadow a reversal, while an oversold RSI (<30) on a widening spread may signal a bounce.
– Trade‑management tip: Trail the stop by 0.3 % of the spread once the trade moves 1 % in your favor, locking in gains while allowing for intraday volatility.
Step 5 — Close or Roll Over
– Exit when the SMT EMA crosses back, indicating that the divergence has dissipated.
– Alternatively, roll the spread into the next expiration if the macro backdrop—such as an earnings season or a scheduled Federal Open Market Committee (FOMC) meeting—still favors the directional bias.
Practical Tips for Better Results
1. Leverage CME’s real‑time “Top‑of‑Book” data to gauge depth. Thin depth can cause slippage on the spread leg, especially during the first 30 minutes after the market opens when liquidity is fragmented across multiple venues.
2. Align trade timing with major market events (FOMC minutes, earnings releases, CPI reports). Heightened volatility can amplify the spread move, but it also widens implied volatility (IV) on options, so keep IV levels reasonable relative to historical norms.
3. Cap notional exposure of the long and short legs within 5 % of your account equity. This buffer helps avoid margin calls if the spread reverses sharply.
4. Apply a volatility filter: avoid initiating a divergence trade when the VIX spikes more than 1.5 % in a 30‑minute window. Extreme fear can distort inter‑market dynamics and produce false signals.
5. Record the Pearson r shift magnitude for each trade. Over time you’ll see a statistical edge when the correlation shift exceeds 0.20, a threshold that research from the Journal of Portfolio Management has identified as meaningful for inter‑market spreads.
6. Prefer European‑style contracts on QQQ and SPY when using options. Early exercise risk is lower, which simplifies delta‑neutral positioning.
7. Back‑test the SMT divergence signal on at least two years of intraday data, then reserve a forward‑testing window to confirm robustness under the current market regime. A rolling window of 250 trading days helps capture both bull and bear cycles.
Common Mistakes to Avoid
– Chasing the signal after the spread has already moved. Late entry erodes the risk‑reward ratio and often forces a tighter stop.
– Ignoring correlation re‑convergence. The spread can snap back quickly once the two indices re‑align, wiping out a half‑built position.
– Over‑leveraging the futures leg. A 10× margin on QQQ can magnify a modest spread reversal into a large loss, especially when the underlying index experiences a sudden swing.
– Failing to adjust for implied volatility. Selling options when IV is low can leave you exposed to sudden spikes that erode the premium you collected.
– Relying on a single indicator. SMT divergence should be confirmed by at least one other metric—MACD, RSI, or a Pearson r shift—before committing capital.
How do I trade SMT divergence between Nasdaq and S&P 500?
Start by building an SMT dashboard that combines a volume‑weighted price ratio, order‑flow data, and a MACD histogram. When the SMT EMA diverges from the spread direction, enter a delta‑neutral futures spread (long QQQ, short SPY for bullish; reverse for bearish) and optionally overlay options to refine risk. Manage the trade with stops tied to spread support/resistance and monitor correlation shifts in real time.
What is SMT divergence in inter‑market analysis?
SMT divergence occurs when a Smart Money Tracker shows opposite momentum on two correlated markets—in this case, Nasdaq versus the S&P 500. The divergence signals that institutional participants are allocating capital unevenly, creating a temporary pricing inefficiency that can be harvested via spread trades.
Why does SMT divergence signal a trade opportunity?
Because it reflects a realignment of smart‑money flow, SMT divergence often precedes a corrective move in the spread. When Nasdaq’s smart‑money indicator climbs while the spread widens, it suggests buying pressure that may push the ratio higher; the opposite holds for bearish signals.
When is the optimal time to enter a trade on SMT divergence?
The best entry is when the SMT EMA first confirms the divergence and the MACD histogram or RSI on the spread provides a secondary confirmation. Enter before the next major market event (e.g., a Fed announcement) to capture the initial spread move, but avoid the last 15 minutes of the trading session when liquidity dries up.
Can I use options to trade SMT divergence?
Yes. Options let you define a defined‑risk profile. A typical structure is a long call on QQQ paired with a short call on SPY for bullish divergence, or a long put spread on SPY with a short put on QQQ for bearish divergence. Ensure the combined delta remains near neutral to keep market exposure limited.
Is SMT divergence reliable for beginners?
SMT divergence can be useful for beginners who respect the discipline of confirmation and risk control. However, the signal relies on nuanced data—order‑flow, correlation shifts—that can be noisy. New traders should start with small position sizes, use a simulated account for at least a month, and always pair the divergence with a clear stop‑loss.
Conclusion
The single most important lesson is that SMT divergence turns the Nasdaq–S&P 500 relationship into a quantitative edge—provided you treat it as a spread, not a directional bet on either index alone. Your next step: build the SMT dashboard, back‑test the divergence signal on recent data, and place a modest, delta‑neutral futures spread on a low‑volatility day. Remember, every trade carries the risk of loss; use stops, size appropriately, and never assume the signal will work in every market regime.
—
This article is for educational purposes only and does not constitute investment advice. Trading and investing carry risk of loss; never invest more than you can afford to lose.
Last reviewed: August 2026