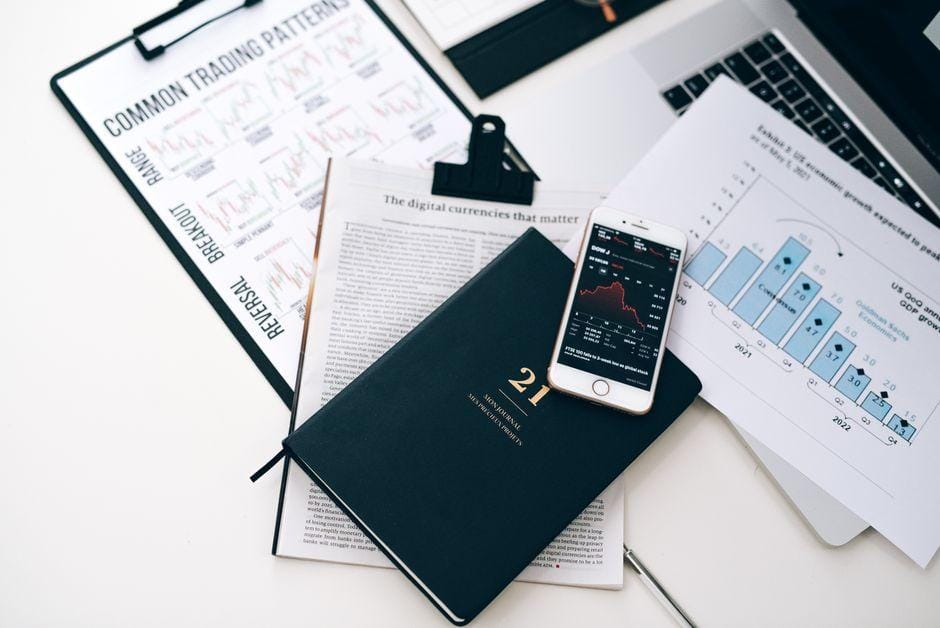
How to Trade False Breakouts During NFP News

Table of Contents
- Introduction
- What Is a False Breakout in NFP Trading
- Why False Breakouts Matter for Traders and Investors
- Core Concepts
- Step-by-Step Guide to Trading False Breakouts
- Practical Tips for Better Results
- Common Mistakes to Avoid
- Frequently Asked Questions
- Conclusion
Introduction
The NFP release window is a battlefield. Every first Friday of the month, millions of dollars in orders sit waiting for the Bureau of Labor Statistics to publish the Non-Farm Payrolls figure. Spreads widen. Liquidity pools thicken at technical levels. And then—price explodes through a key support or resistance level, triggering hundreds of stop-loss orders in milliseconds.
Except the move doesn’t hold.
Within minutes, price reverses. The breakout was fake. The stops have been collected. And the traders who chased the initial move are left holding positions at the worst possible entry.
This is the false breakout, and it happens more often than most retail traders realize. The challenge is distinguishing between a genuine breakout that signals a new trend and a liquidity grab that traps momentum chasers. That distinction separates traders who consistently lose money during high-impact news events from those who profit from the chaos.
This guide shows you how to identify, validate, and trade false breakouts during NFP releases. You’ll learn the mechanics of why these traps form, how to confirm a breakout is genuine before entering, and where to place your stop-loss to avoid getting caught in the very trap you’re trying to trade.
What Is a False Breakout in NFP Trading
A false breakout occurs when price briefly moves beyond a technical level—support, resistance, or a chart pattern boundary—only to reverse and move back in the opposite direction. In the context of NFP trading, this typically means price surges through a key level during the initial volatility spike, triggers a cascade of stop-loss orders, and then rapidly reverses.
The mechanism is straightforward. Large market participants, including institutional traders and market makers, need liquidity to fill their orders. That liquidity comes from retail stop-loss orders sitting just beyond obvious technical levels. When NFP releases, the sudden volatility provides cover to push price into those stop-loss clusters. Once the stops are collected, price often reverses—the original directional move was never supported by genuine order flow.
Consider a real scenario: EUR/USD has been trading in a range with a clear support at 1.0850. During an NFP release, a sudden spike pushes price down to 1.0835, triggering stops below 1.0850. Within 20 minutes, price reverses and rallies to 1.0930—80 pips above the lows. Traders who sold at the breakout now face significant drawdowns while the market moves in the opposite direction.
This is the essence of a false breakout during NFP: price breaks a level, gathers liquidity from the mass of stopped-out traders, then reverses. The traders who entered on the initial breakout become the fuel for the opposite move.
Why False Breakouts Matter for Traders and Investors
NFP is the highest-impact economic release in the forex calendar. It moves markets aggressively—sometimes 50 to 150 pips in major pairs within minutes. The potential for profit is obvious. The potential for catastrophic losses is equally obvious.
The problem is that most traders approach NFP with a simple narrative: the data will be good or bad, and price will move accordingly. That narrative ignores how markets actually behave in the seconds and minutes after release. The initial reaction is often driven by algorithmic order flow, not fundamentals. Liquidity grabs happen fast, and the reversal can be even faster.
Understanding false breakouts matters for three reasons. First, it protects your capital. Chasing every breakout during NFP is a losing strategy because many of those breakouts are traps. Second, it creates opportunity. When you can distinguish a real breakout from a fake one, you can enter trades with much better risk-reward. Third, it builds discipline. Waiting for confirmation before entering forces you to respect the market rather than speculate.
Most traders lose money during high-impact news because they react to the initial move instead of waiting for the market to validate that move. This guide flips that pattern.
Stop Hunt and Liquidity Grab Mechanics
A stop hunt occurs when price moves to capture liquidity sitting behind a technical level. That liquidity comes from stop-loss orders that cluster just beyond support or resistance. Market participants with sufficient size know exactly where these clusters sit—they can see aggregate order flow through their prime brokers.
During NFP, the volatility spike provides perfect cover for a liquidity grab. The rapid price movement triggers algorithmic execution of large orders that push price through the level, collect the stops, and then reverse. The whole sequence can take 30 seconds to five minutes.
To visualize this, imagine EUR/USD trading at 1.0900 with strong support at 1.0850. Thousands of retail traders have placed stop-sell orders below 1.0850, some as far as 1.0830. Large sell orders accumulate at 1.0850. When NFP releases, market participants unload those sell orders, pushing price rapidly below 1.0850. The stops are triggered. Now the market has absorbed all that selling pressure. The large players cover their shorts or go long, and price reverses sharply.
The key insight is that the initial move is often the opposite of what the data actually suggests. You’re not trading the data—you’re trading the liquidity pool.
Candle Close Confirmation Versus Intrabar Breakout
One of the simplest ways to avoid false breakouts is waiting for a candle to close beyond the level before entering. An intrabar breakout—where price briefly goes beyond a level during the candle but closes inside it—is not a breakout at all. It’s noise.
This distinction matters more during NFP because the volatility creates massive intrabar wicks. A candle might spike 40 pips below support during the initial reaction, then close well above support. Traders who entered when price broke below support would have been stopped out within minutes.
The rule is clean: wait for the candle to close beyond the level. If you’re looking at a 15-minute chart around NFP, wait for that 15-minute candle to finish. If it closes beyond your key level, the breakout has a higher probability of being genuine. If it closes back inside the range, it’s likely a false breakout.
This approach costs you some entries. You’ll miss moves that would have continued. But it saves you from the much larger cost of chasing fake breakouts that reverse immediately.
Retest of Broken Support and Resistance
After a false breakout reverses, it often retests the broken level. A retest is when price returns to the level that was previously broken—a support that became resistance or vice versa—and then respects that level again. This retest provides one of the highest-probability entry points in trading.
Here’s why: the level that was broken now acts as a magnet for price. Traders who were stopped out on the wrong side of the breakout often close their positions at break-even when price returns to the level. This creates fresh order flow that pushes price away from the broken level.
In practice, if support at 1.0850 breaks and price reverses, watch for price to return to 1.0850. If it approaches that level and shows rejection—a pin bar, a doji, or simply a slowdown in price—you have confirmation that the breakout was indeed false. You can enter in the direction of the new trend with the broken level as your stop-loss reference.
Volatility Expansion During High-Impact News
Volatility expands dramatically during NFP releases. This expansion has two implications for false breakouts. First, it creates the conditions for exaggerated moves that trigger stops. Second, it means spreads widen, and slippage becomes likely.
The VIX and implied volatility indices spike before and during major data releases. In forex, this translates to wider bid-ask spreads—sometimes 10 to 20 pips on normally tight pairs like EUR/USD. If you’re trading with a broker that doesn’t guarantee stop-loss execution, you can experience significant slippage. A stop-loss set at 1.0830 might fill at 1.0810 or worse.
This is why position sizing during NFP matters. You cannot apply the same risk parameters you use during quiet market hours. A 2% risk position during normal trading might become a 4% or 5% risk position when slippage is factored in. Reduce your size. The increased volatility doesn’t increase your edge—it increases your cost.
Stop Loss Placement Outside the Liquidity Zone
Placing your stop-loss just below the breakout level is a recipe for getting stopped out by the very liquidity grab you’re trying to trade. The liquidity zone extends beyond the obvious level. If support sits at 1.0850, the liquidity zone might extend to 1.0820 or even 1.0800.
Your stop-loss needs to sit outside this zone—far enough that the stop hunt won’t reach it, but close enough that your risk remains manageable. The exact placement depends on the pair, the timeframe, and the current volatility. A reasonable approach is to place stops at least 30 to 50 pips beyond the broken level on major pairs during NFP.
This seems counterintuitive. You’re trying to trade the false breakout, but you’re putting your stop where the liquidity grab would hit. The logic is this: if the breakout is genuine, price won’t return to that area. If it does, your trade is wrong, and you want out. If the false breakout plays out as expected, price reverses before hitting your stop, and you profit.
Step-by-Step Guide to Trading False Breakouts
Step 1: Identify Key Technical Levels Before NFP
Before the release, map out the relevant support and resistance levels on your chart. Use the daily and 4-hour charts to identify zones where price has previously reversed. These are the levels where liquidity pools form.
Focus on round numbers, previous highs and lows, and the boundaries of recent ranges. For EUR/USD, levels like 1.0800, 1.0850, 1.0900 are particularly relevant because they attract large clusters of orders.
Mark these levels clearly. You’ll need them when the release happens.
Step 2: Watch the Initial Reaction Without Entering
When NFP releases, do not enter immediately. The first 30 to 120 seconds are chaos. Price moves based on algorithmic execution, not rational order flow. Watch the initial candle develop on your chosen timeframe.
Your goal is to observe whether the initial move breaks one of your marked levels and whether that breakout holds. Note how far the candle wicks beyond the level and where it closes. This information tells you whether you’re looking at a potential false breakout.
Step 3: Wait for the Retest and Confirm the Trap
Once you’ve identified an initial breakout that closed inside the range—a potential false breakout—wait for price to reverse and retest the broken level. This retest is your entry signal.
The retest should show rejection. Look for a pin bar, a doji, or a candle that struggles to close beyond the broken level. The more clearly price respects the level on retest, the higher your probability.
Enter in the direction of the reversal. Place your stop-loss on the opposite side of the broken level—outside the liquidity zone. Your target should be at least twice your risk. In a false breakout scenario, price often moves significantly in the opposite direction because the momentum that pushed through the level has been exhausted.
Practical Tips for Better Results
- Reduce your position size by 50% or more during NFP releases. Volatility and slippage increase your real risk beyond what your stop-loss suggests.
- Trade only the major pairs during NFP. The liquidity and spread conditions are more favorable than in cross-pairs or exotic pairs.
- Use a broker with negative balance protection and guaranteed stop-loss execution if possible. The slippage during high-impact news can be severe.
- Consider using pending orders rather than market orders during the release. Your fill will be more predictable, though you may miss some moves.
- Keep your analysis simple. During NFP, adding complex indicators creates confusion. Price action and level analysis work best.
- Record every trade you make during NFP. Track what worked, what didn’t, and the conditions at the time. Over months, this data reveals patterns specific to your trading style.
- Accept that you will miss some moves. Waiting for confirmation means entering after the initial surge. This is a feature, not a bug.
Common Mistakes to Avoid
- Entering on the initial breakout without waiting for candle close confirmation. The intrabar spike will trick you into chasing a move that reverses.
- Placing stops too close to the broken level. The liquidity grab extends beyond the obvious support or resistance. Your stop needs breathing room.
- Overtrading during NFP. The volatility feels exciting, but most setups are traps. Patience is your edge.
- Ignoring spread expansion. A wide spread can eat your entire stop-distance before price even moves. Factor this into your position sizing.
- Holding positions over the weekend after NFP. The gap can be severe, and the false breakout pattern may not hold over three days of no trading.
- Revenge trading after a losing NFP trade. The emotional impulse to recover losses leads to worse decisions. Step away if you feel this urge.
- Using the same position size you use in quiet markets. The risk calculation changes when slippage is added to the equation.
Frequently Asked Questions
How do you trade false breakouts during NFP?
Wait for the initial volatility spike to break a key level, then watch for the candle to close back inside the range. Once price reverses and retests the broken level, look for rejection candlesticks and enter in the direction of the reversal. Place your stop outside the liquidity zone and target at least 2:1 risk-reward.
What is a false breakout in forex trading?
A false breakout is when price moves beyond a technical level—support, resistance, or a chart pattern—but fails to sustain the move. The price reverses, often trapping traders who entered on the breakout side. In high-volatility events like NFP, false breakouts are common because the initial move is driven by liquidity grabs rather than genuine order flow.
How do you identify fake breakouts in high volatility?
Look for candle close confirmation. If price spikes beyond a level during the candle but closes inside the range, it’s likely a fake breakout. Another indicator is the speed of reversal—genuine breakouts tend to maintain momentum, while false breakouts reverse within minutes. Finally, watch for a retest of the broken level; if price returns and respects that level, the breakout was likely false.
When do you enter a trade after a false breakout?
Enter when price retests the broken level and shows rejection—a pin bar, doji, or other reversal candlestick pattern. This retest confirms that the original breakout was indeed false and that momentum has shifted. The entry should occur shortly after the retest completes, typically within the same trading session.
Can you profit from false breakouts in NFP?
Yes, but only if you wait for confirmation. The strategy is to enter on the reversal after the false breakout traps the early movers. This approach sacrifices the first part of the move but captures the often larger reversal. The profit potential comes from the trapped traders covering their positions, which adds momentum to the reversal.
Is trading during NFP worth the risk?
This depends on your risk tolerance and preparation. NFP offers significant profit potential but also significant risk. Spreads widen, slippage increases, and false breakouts are common. If you have a tested strategy, proper position sizing, and the discipline to wait for confirmation, trading NFP can be profitable. If you’re chasing every initial move, the risk outweighs the reward.
Conclusion
False breakouts during NFP are not random—they follow observable mechanics. Large market participants need liquidity, and they harvest it by pushing price through levels where retail stops cluster. The initial move looks like a genuine breakout, but it reverses within minutes, leaving chasers with losses and the manipulators with profits.
Your edge is not in predicting which breakout will be false. Your edge is in waiting for confirmation. Let the market show you the trap before you enter. Let the retest validate the reversal. Let your stop-loss sit outside the liquidity zone where the stop hunt won’t reach it.
Start by identifying your key levels before the next NFP. Watch the initial reaction without entering. When the retest comes, take the trade with discipline. This approach won’t catch every move, but it will keep you out of the traps that wipe out most traders.
Remember: the market rewards patience and preparation. The NFP release window is one of the most dangerous times to trade, but also one of the most profitable—if you respect the mechanics and protect your capital first.
Trading involves substantial risk. Past performance does not guarantee future results. Always use proper position sizing and stop-losses.
—
This article is for educational purposes only and does not constitute investment advice. Trading and investing carry risk of loss; never invest more than you can afford to lose.
Last reviewed: August 2026