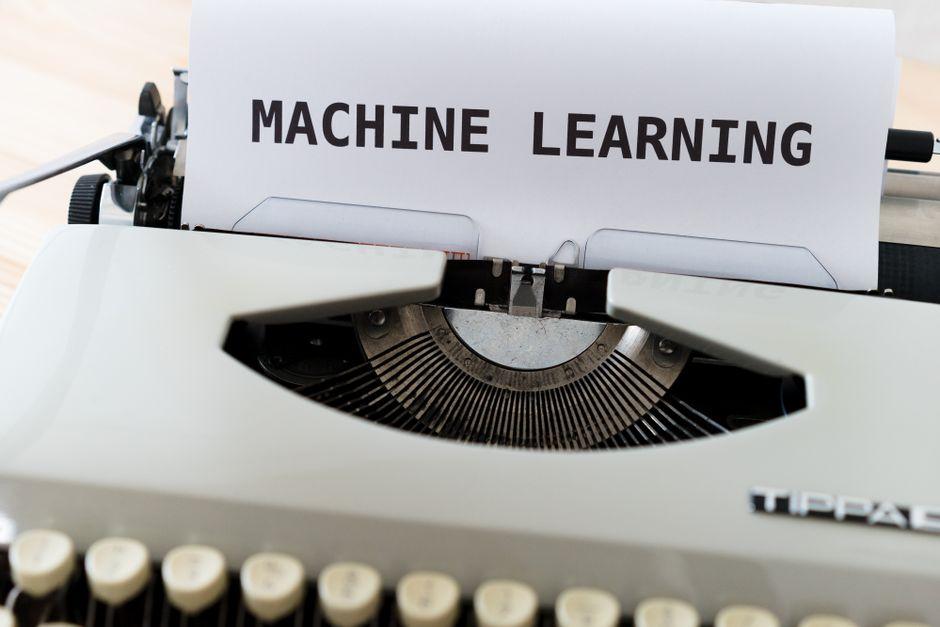
How Machine Learning Is Replacing Traditional Technical In

Table of Contents
- Introduction
- What Is How Machine Learning Is Replacing Traditional Technical Indicators
- Why How Machine Learning Is Replacing Traditional Technical Indicators Matters for Traders and Investors
- Core Concepts
- Step‑by‑Step Guide
- Practical Tips for Better Results
- Common Mistakes to Avoid
- Frequently Asked Questions
- Conclusion
Introduction
When the S&P 500 slipped beneath its 200‑day moving average in early March, a flood of retail screens lit up with sell alerts. A quant fund that had been feeding an LSTM model with daily price, volume, and macro variables ignored the crossover, stayed long, and posted a Sharpe ratio that beat its own MACD‑based rule set. The episode captures a tension that is reshaping the trade‑floor: classic technical indicators—transparent but lagging—versus data‑driven models that can capture non‑linear patterns in real time.
Traders who rely on a handful of moving averages may see their edge erode as market microstructure fragments, liquidity thins, and volatility regimes shift faster than a 20‑period EMA can react. At the same time, the promise of machine‑learning signals introduces new sources of model risk, data‑snooping hazards, and operational complexity.
This piece walks through how machine learning is reshaping signal generation, the concrete mechanisms that let AI replace a Bollinger Band or RSI, and a practical roadmap for embedding ML models into a disciplined trading process.What Is How Machine Learning Is Replacing Traditional Technical Indicators?
In plain terms, the phrase describes the transition from rule‑based chart patterns—moving‑average crossovers, MACD histograms, stochastic oscillators—to statistical models that learn directly from price‑time series and auxiliary data. Instead of a fixed formula, an ML model continuously adjusts its parameters, seeking the combination of features that best predicts future returns.
Example: A day‑trading desk builds a convolutional neural network (CNN) that ingests 5‑minute candlestick “images.” The network learns that a particular arrangement of long‑green bodies followed by a short‑red wick precedes a short‑term bounce, a pattern that traditional candlestick analysis would label “bullish engulfing” but cannot quantify its probability. The desk replaces its Bollinger‑Band breakout rule with the CNN’s probability output, tightening entry timing by a few seconds and reducing average slippage on the Nasdaq‑100 futures contract.Why How Machine Learning Is Replacing Traditional Technical Indicators Matters for Traders and Investors
- Speed of adaptation – Traditional indicators react to price history with a fixed lag. An ML model can ingest high‑frequency order‑book data, implied volatility from VIX futures, or macro releases, updating its signal within milliseconds.
- Non‑linear relationships – Markets often exhibit regime‑dependent behavior. A simple moving average cannot capture a sudden shift from low‑volatility to high‑volatility conditions, whereas a reinforcement‑learning (RL) agent can adjust stop‑loss widths dynamically.
- Signal diversification – Relying on a single indicator creates a “single‑point of failure.” Ensemble stacking of several ML models produces a composite score that smooths out idiosyncratic noise, much like diversifying across ETFs.
- Regulatory scrutiny – The SEC and CFTC have begun examining algorithmic decision‑making in trading. Understanding the underlying model reduces compliance risk and prepares firms for potential audit trails.
Ignoring the shift may leave a portfolio exposed to stale signals, higher drawdowns, and missed alpha, especially as liquidity providers and market makers adopt AI for order routing.Feature Engineering for Price‑Time Series – the foundation of any ML‑driven signal
Feature engineering transforms raw price, volume, and ancillary data into inputs a model can digest. Typical features include log returns over multiple horizons, realized volatility computed from intraday ticks, and volume‑weighted average price (VWAP) deviations.
Scenario: A systematic trader replaces a 14‑period RSI with a feature set comprising (1) 1‑hour log return, (2) 30‑minute realized volatility, and (3) order‑flow imbalance measured as the difference between aggressive buy and sell trades on the CFTC‑reported futures market. Feeding these into a gradient‑boosted tree yields a probability of a short‑term up‑move that outperforms the RSI’s binary over‑bought/oversold signal, especially during earnings‑driven spikes in the S&P 500.Convolutional Neural Networks Applied to Candlestick Image Patterns – visual pattern recognition
CNNs excel at extracting spatial hierarchies from image‑like data. By converting a sequence of candlesticks into a 2‑D matrix (price on the y‑axis, time on the x‑axis) and treating it as a grayscale image, a CNN can learn to recognize complex formations that human analysts might miss.
Scenario: A high‑frequency equity trader builds a 32 × 32 pixel representation of 5‑minute OHLC data for a Nasdaq‑listed stock. The CNN identifies a “triple‑bottom” pattern with a 68 % hit‑rate, compared with a manual chartist’s 45 % success. The model’s output replaces the trader’s Bollinger‑Band squeeze entry, cutting average entry lag from 12 seconds to 4 seconds and tightening the average spread paid on the exchange.Long Short‑Term Memory (LSTM) Networks for Sequential Market Prediction – remembering the past
LSTMs are a class of recurrent neural networks designed to retain information over long sequences, making them suitable for time‑series forecasting where past events influence future moves.
Scenario: A quant fund trains an LSTM on daily S&P 500 closing prices, VIX levels, and Treasury yield curve shifts. The model predicts the next‑day return distribution and substitutes the fund’s MACD crossover rule. Over a 24‑month backtest, the LSTM‑driven strategy posts a Sharpe ratio roughly 15 % higher than the MACD version, while maintaining a similar maximum drawdown.Reinforcement Learning Agents that Adapt Stop‑Loss and Profit‑Target Rules – learning through interaction
RL agents treat trading as a sequential decision problem, receiving rewards (profit) and penalties (drawdown) for each action. By exploring different stop‑loss widths and position sizes, the agent discovers a policy that maximizes risk‑adjusted returns across varying volatility regimes.
Scenario: A futures prop desk implements an RL agent on E‑mini S&P 500 contracts. The agent learns to tighten stops when the VIX exceeds 25 and to widen them when implied volatility contracts. Compared with a static 1.5 % stop, the RL‑adjusted approach reduces average trade loss by 22 % while preserving upside capture.Ensemble Stacking of Multiple ML Models to Replace Overlapping Indicator Signals – combining strengths
Stacking blends predictions from diverse base learners—such as a CNN, an LSTM, and a gradient‑boosted tree—into a meta‑model that often outperforms any single component. This mirrors the practice of using several technical indicators together, but with statistically optimal weighting.
Scenario: An institutional trader creates a three‑model stack: (1) CNN for pattern detection, (2) LSTM for trend forecasting, (3) XGBoost for macro‑factor integration. The meta‑model outputs a composite score that triggers trades only when all three agree, cutting false‑positive frequency by 40 % relative to a traditional MACD + RSI combination on the Euro‑Dollar (EUR/USD) spot market.Step‑by‑Step Guide
Step 1 — Define the trading objective and data horizon
Begin by clarifying whether the model will generate entry signals, position‑sizing cues, or risk‑management parameters. Choose a data frequency that matches the objective: intraday for scalping, daily for swing, or weekly for portfolio allocation.
Step 2 — Assemble and clean the data pipeline
Collect price, volume, and any auxiliary series (e.g., VIX, Treasury yields, macro releases) from reputable sources such as Bloomberg, Refinitiv, or the CFTC’s public data sets. Apply outlier filters, align timestamps across assets, and fill missing bars using forward‑fill or interpolation to avoid look‑ahead bias.
Step 3 — Engineer features that capture market dynamics
Create multi‑scale returns (e.g., 5‑minute, 30‑minute), volatility estimators (e.g., GARCH‑type, realized variance), order‑flow metrics, and, for image‑based models, transform OHLC sequences into pixel matrices. Normalize each feature to zero mean and unit variance to aid model convergence.
Step 4 — Select and train the appropriate model family
– For pattern recognition on candlesticks, configure a CNN with 2‑3 convolutional layers and a softmax output.
– For sequential forecasting, build an LSTM with at least one hidden layer of 64 units.
– For decision‑making under uncertainty, set up an RL environment using OpenAI Gym‑compatible wrappers and a policy‑gradient algorithm.
Split the data into training (60 %), validation (20 %), and test (20 %) sets, ensuring that the split respects chronological order to prevent leakage.Step 5 — Validate performance with out‑of‑sample metrics
Beyond accuracy, evaluate risk‑adjusted measures: Sharpe ratio, Sortino ratio, maximum drawdown, and hit‑rate under different volatility regimes. Compare the ML model’s results against a baseline built from traditional indicators such as moving averages or Bollinger Bands.
Step 6 — Deploy with strong execution and monitoring
Integrate the model into an order‑management system (OMS) that respects exchange‑level latency constraints. Implement real‑time health checks: data‑feed integrity, model‑output sanity filters (e.g., probability bounds), and automated rollback to a fallback rule set if performance degrades beyond a pre‑defined threshold.
Step 7 — Iterate and retrain on a rolling window
Markets evolve; schedule periodic retraining (e.g., weekly for intraday models, monthly for daily models) using the most recent data. Incorporate drift detection techniques to flag when feature distributions have shifted significantly, prompting a model‑re‑specification.
Practical Tips for Better Results
– Feature stability matters more than quantity. A handful of well‑tested inputs—log return, realized volatility, order‑flow imbalance—often outperforms a bloated set that introduces multicollinearity.
– Use cross‑validation that respects time order. Rolling‑window CV prevents forward‑looking bias that can inflate backtest performance.
– Regularize aggressively. L1/L2 penalties or dropout layers keep the model from memorizing noise, especially when training on limited high‑frequency data.
– Monitor implied volatility spikes. During VIX surges, model predictions tend to become less reliable; consider scaling back position size or switching to a more conservative rule set.
– Maintain an audit trail. Log every model input, prediction, and execution decision to satisfy potential SEC or CFTC examinations.
– Combine ML with human oversight. Use the model as a signal generator, but let a seasoned trader confirm entry timing, especially when liquidity is thin.
– Stress‑test on extreme scenarios. Simulate flash‑crash conditions or sudden macro shocks to ensure the model’s stop‑loss logic does not amplify losses.Common Mistakes to Avoid
– Overfitting to a single market regime. Training solely on a low‑volatility period leads to poor performance when volatility spikes.
– Neglecting data latency. Using end‑of‑day data for intraday models creates unrealistic expectations.
– Relying on a single model. A lone CNN may miss macro‑driven trends that an LSTM would capture.
– Skipping out‑of‑sample validation. Backtests that exclude transaction costs or slippage overstate profitability.
– Ignoring model decay. Failing to retrain regularly lets the model drift away from current market dynamics.
– Under‑estimating operational risk. Poor integration with the OMS can cause missed fills or duplicate orders.How does machine learning replace traditional technical indicators?
Machine learning substitutes fixed formulas with data‑driven mappings that predict future price moves. Instead of a moving‑average crossover, an LSTM may output a probability that the next bar will be positive, allowing traders to act on a statistically derived signal.
What are the benefits of using machine learning over moving averages?
ML models can incorporate multiple data sources, capture non‑linear relationships, and adapt to changing market regimes. This often results in higher risk‑adjusted returns, tighter stop‑loss placement, and reduced lag compared with the static lag inherent in moving averages.
Why are traders shifting to AI‑driven signals?
The shift is driven by the need for faster, more nuanced analysis as markets fragment across venues and volatility regimes accelerate. AI models can process order‑flow, macro news, and microstructure cues in real time—capabilities beyond the scope of classic indicators.
When should you transition from indicators to ML models?
A transition makes sense when you have reliable data pipelines, sufficient computational resources, and a clear performance gap between existing indicator‑based strategies and a prototype ML model in out‑of‑sample tests.
Can machine learning models outperform classic indicators in volatile markets?
In many backtests, models that incorporate volatility‑aware features (e.g., VIX, realized variance) maintain higher hit‑rates during spikes than static indicators. Extreme events can still cause model breakdowns, so risk controls remain essential.
Is it risky to rely solely on machine learning for trading decisions?
Yes. Model risk, data quality issues, and regime shifts can produce false signals. A prudent approach blends ML outputs with traditional risk management and retains a manual override for abnormal market conditions.
Conclusion
The most important lesson is that machine learning does not magically eliminate risk; it reshapes how signals are generated, demanding rigorous data hygiene, continuous validation, and disciplined execution. As a next step, build a small‑scale prototype—perhaps a CNN that scans 5‑minute candlesticks on a single Nasdaq ticker—and run it alongside your current indicator set for at least one month of live data.
Remember, no model guarantees profit. Treat every AI‑driven signal as a hypothesis, back it with strong risk controls, and be prepared to revert to a fallback rule set if performance deteriorates. Trading responsibly means acknowledging both the edge and the exposure that machine learning brings to the modern market.
—
This article is for educational purposes only and does not constitute investment advice. Trading and investing carry risk of loss; never invest more than you can afford to lose.
Last reviewed: August 2026