Complete Interest Rates Guide for Beginners (2024)

Table of Contents
- Introduction
- What Is Interest Rate?
- Why Interest Rates Matter for Traders and Investors
- Core Concepts
- Step-by-Step Guide
- Practical Tips for Better Results
- Common Mistakes to Avoid
- Frequently Asked Questions
- Conclusion
Introduction
You’re shopping for a mortgage and two lenders offer nearly identical rates—one at 6.5% with no upfront costs, another at 6.0% but requiring $8,000 in points. Which is the better deal? The answer isn’t obvious until you understand how interest rates truly work.
Interest rates are the foundation of every financial decision: the mortgage you qualify for, the return you earn on savings, the yield on bonds, and even stock valuations. Yet many investors and borrowers operate without understanding the mechanics driving these numbers. That gap costs money—often tens of thousands of dollars over the life of a loan or investment.
This guide breaks down complete interest rates from the ground up. You’ll learn the difference between simple and compound interest, why APR and APY matter, how the Federal Reserve influences benchmark rates, and what the yield curve signals about the economy. By the end, you’ll make smarter borrowing and investing decisions with confidence.
What Is Interest Rate?
An interest rate represents the cost of borrowing money, expressed as a percentage of the principal over a specific period—typically one year. When you deposit money in a savings account, the interest rate is your reward for letting the bank use your funds. When you borrow to buy a home or car, the interest rate is the fee you pay for that privilege.
The rate reflects several factors: inflation expectations, the supply and demand for credit, the borrower’s creditworthiness, and the overall economic environment. A rate of 5% means that for every $100 borrowed, the borrower pays $5 annually in interest.
Understanding interest rates requires grasping both the nominal rate—the stated percentage—and the real rate, which adjusts for inflation. If your savings account pays 4% but inflation runs at 3%, your real return is roughly 1%. This distinction matters enormously for long-term financial planning.
Why Interest Rates Matter for Traders and Investors
Interest rates permeate every corner of financial markets. They determine mortgage payments for homebuyers, yield levels for bond investors, financing costs for corporations, and even stock valuations through the discount rate applied to future cash flows.
For traders, rate changes create opportunities. When the Federal Reserve signals a pause in rate hikes, bond prices typically rise—benefiting holders of existing bonds. When rates fall, dividend-paying stocks often become more attractive as the competition from fixed-income yields diminishes. Conversely, rate hikes pressure sectors sensitive to borrowing costs, including real estate and utilities.
Ignoring interest rate dynamics means missing a critical driver of portfolio performance. Over the past two decades, major market moves—from the 2008 financial crisis to the 2022 bond rout—were fundamentally about interest rates and their impact on asset prices. Whether you’re holding a 401(k) or trading options, understanding rates helps you anticipate risk and reward.
Compound Interest and the Power of Exponential Growth
Compound interest is interest earned on interest. Unlike simple interest, which calculates returns only on the original principal, compound interest calculates returns on the principal plus all previously earned interest. This difference creates exponential growth over time.
Here’s how it works in practice. Suppose you deposit $10,000 in a high-yield savings account at 4.5% APY, compounding annually. After one year, you have $10,450. After ten years, your balance grows to $15,529—more than 55% of your original deposit, even though the rate never changed. The longer you hold, the faster the growth accelerates.
Now compare this to simple interest at the same rate. With simple interest, you’d earn $450 every year, totaling $4,500 over ten years—a $10,000 principal plus $4,500 interest, or $14,500 total. The compound account delivered $1,029 more simply by reinvesting the interest.
The rule of 72 offers a quick way to estimate how long it takes your money to double at a given rate. Divide 72 by your annual interest rate. At 4.5%, 72 ÷ 4.5 = 16 years to double. At 7.2%, it takes roughly ten years. This arithmetic explains why starting to save early matters so much—the time value of money rewards patience.
APR vs APY: Understanding the Real Cost of Borrowing
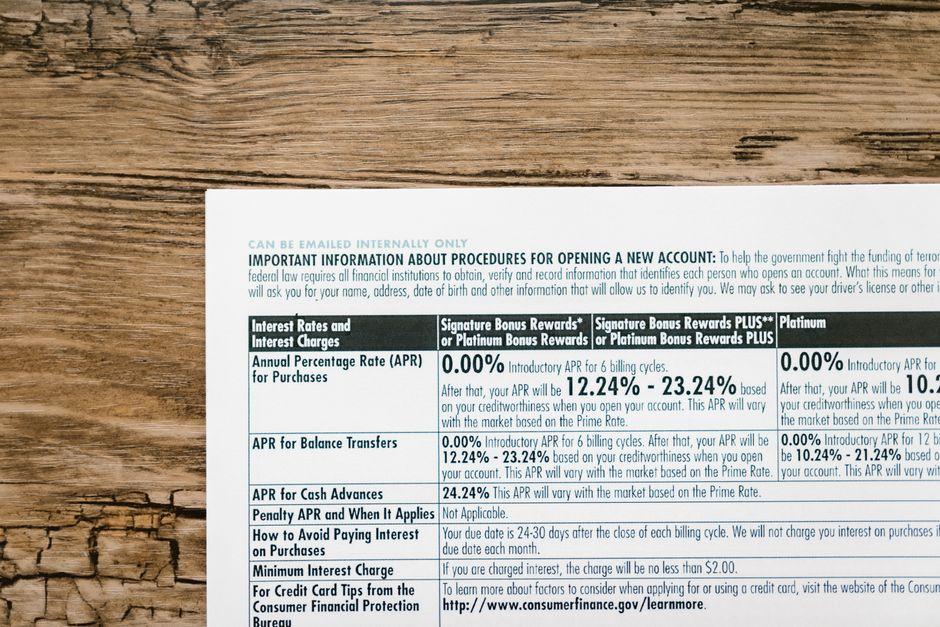
APR (annual percentage rate) and APY (annual percentage yield) sound similar but serve different purposes. APR represents the yearly cost of borrowing, including the interest rate plus certain fees, but does not account for compounding within the year. APY includes the effect of compounding, showing the true annual return on a savings product or the true annual cost of a loan when interest compounds more frequently than annually.
For borrowers, APR is the more accurate measure of loan cost. For savers, APY reflects actual earnings. The distinction becomes critical when comparing mortgage offers or evaluating high-yield accounts.
Consider two mortgage offers on a $300,000 home loan:
– Option A: 6.5% APR with no points (no upfront fees)
– Option B: 6.0% APR with $8,000 in points (upfront cost)
Option B charges $8,000 upfront to lower your rate by 0.5 percentage points. Over five years, the lower rate saves approximately $7,800 in interest—nearly breaking even. Over ten years, the savings exceed $15,000, making the points worthwhile if you stay in the home long enough. Calculating the break-even point helps you choose the better deal based on how long you expect to keep the loan.
The Federal Reserve’s Role in Setting Benchmark Interest Rates
The Federal Reserve doesn’t set mortgage rates or savings account yields directly. Instead, it controls the federal funds rate—the rate at which banks lend to each other overnight. This benchmark influences short-term interest rates across the economy, with changes rippling through adjustable-rate mortgages, credit cards, business loans, and savings yields.
The Fed adjusts rates to pursue its dual mandate: maximum employment and stable prices. When inflation runs hot, the Fed raises rates to cool economic activity and bring price growth back toward its 2% target. When the economy weakens, it lowers rates to stimulate borrowing, spending, and hiring.
Market participants closely watch Fed communications for clues about future rate moves. The central bank signals its intentions through the federal funds rate target range, economic projections, and statements from Fed officials. A 0.25% rate cut might seem small, but it affects trillions of dollars in assets. Existing bonds with fixed coupons become more valuable when rates fall—their yields are now higher relative to new issues. New bond buyers lock in lower yields, while existing borrowers with adjustable-rate loans see their payments decrease.
The Yield Curve and How It Predicts Economic Trends
The yield curve plots interest rates across different maturities—say, the 2-year, 5-year, 10-year, and 30-year Treasury yields. Its shape signals market expectations about future economic conditions and Fed policy.
A normal upward-sloping curve reflects expectations of stronger growth and higher future inflation. Investors demand higher yields for locking money away longer. An inverted curve, where short-term rates exceed long-term rates, historically signals recession risk. Investors bet that the Fed will need to cut rates sharply in the future as the economy slows—a bet that has proven prescient in most recessions over the past fifty years.
The 10-year Treasury yield serves as a benchmark for mortgage rates. When the 10-year yield rises, mortgage rates typically follow. In 2023, as the Fed raised rates and inflation persisted, the 10-year yield briefly exceeded 5%, pushing 30-year fixed mortgages above 7%—the highest levels in two decades. Tracking the yield curve helps you anticipate rate moves affecting your mortgage, bond holdings, and stock portfolio.
Inflation’s Impact on Real Interest Rates
The nominal interest rate is what you see advertised. The real interest rate is nominal minus inflation. If your CD pays 5% but inflation runs at 3.2%, your real return is approximately 1.8%. That $5,000 earned on a $100,000 CD actually buys less goods and services after accounting for rising prices.
Central banks target positive real rates—that is, rates above inflation—to ensure lenders earn a return after prices rise. When inflation spikes, nominal rates may not keep pace immediately, creating negative real rates that erode purchasing power. This situation hurt savers during the 1970s and briefly in 2021-2022 when inflation surged but rates hadn’t yet risen correspondingly.
For investors, calculating real returns matters more than chasing nominal yields. A bond paying 6% sounds attractive, but if inflation is 5%, your real gain is just 1%. A stock portfolio with 8% nominal returns might deliver 3% real returns if inflation averages 5%—potentially superior to the bond’s real yield.
Core Concepts
Step 1 — Calculate Simple vs Compound Interest
To compare simple and compound interest, use these formulas:
Simple Interest = Principal × Rate × Time
Compound Interest = Principal × (1 + Rate)^Time – Principal
For a $10,000 investment at 5% over five years:
– Simple: $10,000 × 0.05 × 5 = $2,500 interest
– Compound: $10,000 × (1.05)^5 – $10,000 = $10,000 × 1.276 – $10,000 = $2,763
The difference grows dramatically over longer periods. Use an online calculator or spreadsheet to model different scenarios before making large financial decisions.
Step 2 — Compare Loans Using APR
When evaluating loans, always compare APR rather than the stated rate. APR factors in origination fees, discount points, and other upfront costs, giving you a true apples-to-apples comparison.
Gather loan offers from multiple lenders. Subtract any points or fees from the loan amount to see what you’re actually borrowing. Then compare the total interest paid over the loan term, factoring in the time value of money. A lower APR with points might make sense if you plan to stay in the home beyond the break-even point.
Step 3 — Monitor Fed Policy and Yield Curve Signals
Stay informed about Federal Reserve communications. The Fed publishes meeting minutes two weeks after each gathering, and Fed officials give speeches throughout the year that markets parse for policy clues. The CME FedWatch Tool tracks market-implied probabilities of future rate moves.
Watch the 2-year and 10-year Treasury spread. An inverted curve—where the 2-year yield exceeds the 10-year—has preceded every recession since 1955. While not a perfect predictor, it’s one of the most reliable indicators of economic risk. Adjust your portfolio accordingly: consider reducing exposure to interest-rate-sensitive sectors when the curve inverts.
Practical Tips for Better Results
- When choosing between a mortgage with points and one without, calculate your break-even point based on how long you expect to keep the loan.
- High-yield savings accounts now offer rates competitive with certificates of deposit while maintaining liquidity—compare APY, not just advertised rates.
- Ladder your bond holdings across different maturities to reduce reinvestment risk when rates change.
- Consider TIPS (Treasury Inflation-Protected Securities) to hedge against inflation eroding your fixed-income returns.
- Review your portfolio’s duration—a measure of interest-rate sensitivity—when the Fed signals major policy shifts.
- Auto-pay discounts on loans often range from 0.25% to 0.5%—small but meaningful savings over time.
Common Mistakes to Avoid
- Ignoring the difference between APR and APY leads to overestimating returns or underestimating borrowing costs.
- Chasing the highest nominal yield without considering inflation erodes your purchasing power.
- Locking into a fixed-rate mortgage at cycle highs when rates might fall—evaluate your timeline and risk tolerance.
- Assuming the Fed’s rate move directly translates to equal changes in mortgage or savings rates; other factors influence these products.
- Neglecting to compare multiple lenders; small differences in APR compound into large dollar amounts over 15 or 30 years.
Frequently Asked Questions
What is the difference between simple interest and compound interest?
Simple interest calculates returns only on the original principal amount. Compound interest calculates returns on the principal plus all previously earned interest. Over time, compound interest produces significantly higher returns because you earn interest on your interest. For a $10,000 investment at 5% over ten years, simple interest yields $5,000 total, while compound interest yields approximately $6,289.
How do interest rates affect mortgage payments?
Interest rates directly determine your monthly mortgage payment for fixed-rate loans. A 0.5% rate difference on a $300,000, 30-year loan changes your monthly payment by roughly $90—over $32,000 in total interest over the loan’s life. With adjustable-rate mortgages, your payment changes when the benchmark rate adjusts. Even small rate differences have massive long-term cost implications.
What is a good interest rate for a savings account in 2024?
High-yield savings accounts in 2024 offer APYs around 4.5% to 5.0%, substantially higher than traditional banks that often pay below 0.5%. The best rates typically come from online banks without physical branch networks. Compare APY rather than APR, and remember that rates are variable and will change as the Fed adjusts benchmark rates.
How does the Federal Reserve influence interest rates?
The Federal Reserve sets the federal funds rate, which is the interest rate banks charge each other for overnight loans. This benchmark influences short-term rates throughout the economy. While the Fed doesn’t directly set mortgage or savings rates, changes to the fed funds rate affect these products indirectly through market mechanisms. The Fed also conducts open market operations and sets discount window rates.
Why do interest rates change over time?
Interest rates fluctuate based on inflation expectations, economic growth, central bank policy, and supply-demand dynamics in credit markets. When inflation rises, lenders demand higher rates to compensate for eroding purchasing power. Strong economic growth increases borrowing demand, pushing rates up. The Fed adjusts rates to achieve its inflation and employment targets, creating cycles of rate hikes and cuts.
Can negative interest rates happen in the US?
The US has not experienced negative nominal interest rates, though real returns have been negative during high-inflation periods. Some European and Asian central banks have employed negative rates to stimulate growth, but the Federal Reserve has historically avoided this tool. Negative rates would theoretically encourage lending and discourage saving, but they also disrupt banking systems and could encourage withdrawal of deposits.
Conclusion
Interest rates aren’t just numbers on a page—they’re the price of money and the foundation of every financial decision. Understanding how compound interest grows your wealth, why APR and APY matter when borrowing, what drives Federal Reserve policy, and what the yield curve signals about the economy gives you a decisive edge.
The single most important lesson: small differences in interest rates compound into enormous dollar amounts over time. Whether you’re choosing a mortgage, selecting a savings account, or allocating your portfolio, those decimal points matter. Run the calculations yourself before committing capital.
Start by checking your current savings yields and mortgage rate. Compare offers using APR. Monitor the Fed’s communications and the yield curve’s shape. These habits take minutes but save thousands over a financial lifetime. As with all investing, returns aren’t guaranteed, and rates fluctuate with economic conditions—staying informed is your best protection.
—
This article is for educational purposes only and does not constitute investment advice. Trading and investing carry risk of loss; never invest more than you can afford to lose.
Last reviewed: August 2026