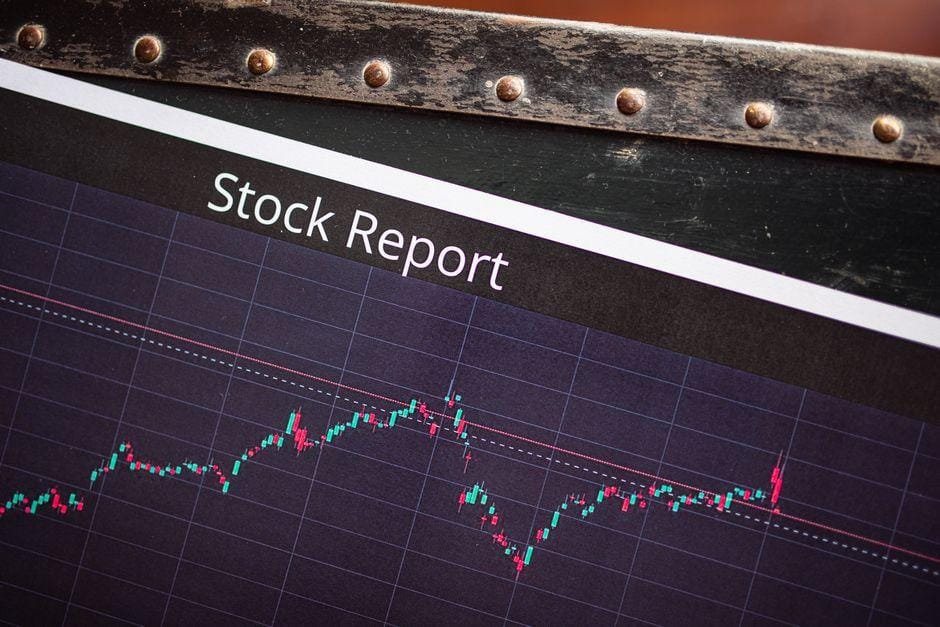
Best US Stocks: 5 Confirmation Signals for Traders

Table of Contents
- Introduction
- What Are Confirmation Signals
- Why Confirmation Signals Matter for Traders and Investors
- Core Concepts: The Five-Signal Stack
- Step-by-Step Guide: Running a Trade Through the Stack
- Practical Tips for Better Results
- Common Mistakes to Avoid
- Frequently Asked Questions
- Conclusion
Introduction
Best stocks sits at the center of this guide, and the way traders approach the market shifts once confirmation is taken seriously.
Picture a trader scanning a watchlist on a quiet Tuesday. A high-flying semiconductor name presses against a resistance level it has tested three times. The pattern looks textbook. The temptation to click buy is enormous. Most false breakouts start exactly there.
The gap between a clean entry and a stop-out usually traces back to one habit: waiting for confirmation. A confirmation signal is any independent piece of evidence — volume, momentum, relative strength, or trend structure — that agrees with the price move before a trader commits capital. On the best US stocks, the signal that works in isolation often fails. The signal stack that combines several indicators is what separates the professionals from the crowd.
This guide walks through the five confirmation signals most consistently referenced by professional traders, runs through two chart scenarios, and shows how to combine them into a repeatable decision process that filters false breakouts and improves entry timing.
What Are Confirmation Signals
A confirmation signal is a second, independent piece of market evidence that validates a primary trade thesis. The thesis is usually price action itself: a breakout, a pullback to support, or a trend resumption. The confirmation is anything that backs that thesis from a different angle — volume statistics, momentum oscillators, moving-average structure, or relative-strength comparisons.
The point is to require the market to “say yes” twice. A breakout on light volume is one voice. A breakout on heavy volume, with the relative-strength line making a new high against the S&P 500, is a chorus. Confirmation reduces reliance on a single indicator, which in turn lowers the drawdowns that come from one-tool trading.
Consider a trader watching a large-cap technology name test the underside of a former breakout level. A single close above resistance is not enough. A close above resistance on above-average volume, with the MACD line crossing above its signal line and the relative-strength line against SPY also pressing to a new high, is a meaningfully stronger setup. Same price, different signal stack, very different expectancy.
Why Confirmation Signals Matter for Traders and Investors
Breakout failure is the most expensive routine in active trading. A study habit, a backtest framework, and a journal can all be in place, and one impulsive entry on a head-fake still blows up the equity curve. Confirmation is the cheapest insurance against that single mistake.
There is also a market-structure argument. The US equity market is dominated by institutional order flow from pensions, mutual funds, and exchange-traded funds. Retail traders who step in front of those flows without confirming them tend to be the liquidity being taken, not the liquidity being provided. Confirmation reads where the bigger players are positioned and helps the trader avoid being the exit liquidity for a position being distributed into a breakout.
For longer-horizon investors, confirmation matters differently. Pulling the trigger on a position size that runs 5% of the portfolio is easier when three different indicators agree on direction than when one candle pattern does. Confirmation also lowers the psychological cost of holding through volatility, which is usually what decides whether the position is held long enough to capture the trend.
Traders who skip confirmation tend to suffer the same pattern: a string of small wins followed by a single outsized loss that gives back most of the gains. The five-signal stack is built to break that pattern by requiring the market to show its hand before the trader shows theirs.
Core Concepts: The Five-Signal Stack
The five signals below are not the only confirmation tools available. They are the ones most consistently cited by active US-equity traders, and they span four independent dimensions: participation (volume), trend structure (moving averages), momentum (oscillators), and relative performance (the RS line).
Volume-Price Confirmation: Validating Breakouts With Above-Average Volume
Volume is the participation meter. When a stock breaks resistance on volume that runs two-to-three times its 30-day average, the move is more likely to be backed by real orders rather than a thin market bouncing on noise. When a stock breaks resistance on below-average volume, the move is statistically more likely to fail.
A working filter is to require breakouts to print on volume at least 1.5x the 20-day average, and ideally 2x or more. On-Balance Volume (OBV) is a secondary check. If price is breaking out but OBV is flat or making lower highs, the move is suspect — cumulative buying pressure is not actually expanding.
Concrete scenario: NVDA presses against a resistance level near a recent swing high. Over the prior five sessions, daily volume has averaged the 30-day baseline. On the breakout day, volume prints at roughly 2.3x the 30-day average and OBV pushes to a fresh high. That is a confirmed volume signature. Add a MACD bullish crossover on the daily, and the breakout carries two independent confirmations before the trader even looks at relative strength.
Moving Average Stack Alignment: Confirming Trend Strength
Moving averages are the slow-grade trend filter. The 20-, 50-, and 200-day exponential moving averages (EMAs) stacked in bullish order — 20 above 50 above 200 — describe a stock in a confirmed uptrend. A pullback that holds the rising 20-day EMA, with the 50-day EMA still sloping higher, is a higher-probability entry than a random bounce off an arbitrary horizontal line.
A useful checklist: the 20-day EMA is above the 50-day EMA, the 50-day is above the 200-day, and the slope of all three is positive. If even one of those conditions fails, the trend is not as strong as the chart appears, and the trader should size down or wait. The same logic in reverse describes downtrends and short setups. A stock where the 20-day EMA is rolling over and crossing below the 50-day, with the 200-day flattening, sits in a regime where long confirmations are less reliable.
Momentum Confirmation: MACD, RSI, and Bullish Divergence
Momentum oscillators confirm that the move has energy behind it. The two most useful for US-equity swing traders are the Moving Average Convergence Divergence (MACD) and the Relative Strength Index (RSI).
A bullish MACD signal-line crossover during a breakout adds an independent confirmation that the underlying momentum has turned. A bearish MACD crossover during a pullback warns that the bounce is more likely to fail. The 12/26/9 MACD settings are the most common on daily charts.
RSI contributes two specific tools. RSI holding above 50 in an uptrend confirms that the trend has not lost internal energy. A bullish RSI divergence at a pullback — when price prints a lower low but RSI prints a higher low — often marks the end of a corrective phase before the next leg up.
Concrete scenario: AAPL pulls back over several sessions toward a rising 50-day EMA. The 50-day holds. RSI prints a higher low even as price makes a slightly lower low, which is a classic bullish divergence. MACD is curling upward but has not yet crossed its signal line. That combination — price holding the 50-day, RSI divergence, and MACD starting to turn — is a textbook pullback-confirmation pattern for one of the most-followed names on the Nasdaq.
Relative Strength vs. SPY: Buying the Strong, Not the Weak
Relative strength isolates stocks that are outperforming the broad market. A stock can be in an uptrend and still be losing ground to the S&P 500 (SPY). Buying the laggard during a sector rotation is one of the most common swing-trade mistakes.
The mechanics are straightforward. Divide the stock’s price by SPY’s price and chart the ratio. A rising line means the stock is outperforming; a falling line means it is underperforming. The most reliable entry signals come when both the stock and the ratio are simultaneously making new highs.
For additional filtering, traders compare the stock to its sector ETF — XLK for technology, XLF for financials, XLE for energy. A stock that is making new highs versus SPY but lagging versus its sector ETF is hiding relative weakness that often shows up later as a sharp drawdown.
Concrete scenario: As NVDA presses through the resistance level, the relative-strength line against SPY is also at a new high, while the line against XLK is at least above its 20-day moving average. That tells the trader the stock is leading both the broad market and its own sector, which historically is where the largest follow-through moves originate.
Volatility Compression Alignment: Bollinger Bands and Keltner Channels
The fifth signal is volatility compression. The TTM Squeeze, a popular indicator, plots when Bollinger Bands contract inside Keltner Channels. When the bands sit inside the channels, the stock is coiling. When they release, the stock often begins a directional move that is itself the breakout. Adding a momentum histogram firing in the same direction as the release provides a fifth, independent confirmation.
The squeeze is not a stand-alone entry. It is a regime indicator that says the next breakout is more likely to matter. Combining the squeeze release with a volume expansion and an RS line at new highs is a high-probability configuration, especially on the daily chart of large-cap names with deep liquidity.
Step-by-Step Guide: Running a Trade Through the Stack
The five signals only create value if they are applied mechanically. The following sequence is a practical decision process for a swing-trade entry on a US large-cap, drawn from how professional desks filter setups before they allocate risk.
Step 1 — Define the Setup and the Stop Before Looking at Indicators
Choose the setup category first: breakout, pullback, or trend resumption. Note the trigger — the price level where the idea goes “live” — and the invalidation point, the level that, if broken, kills the thesis. Position size should be calculated from that stop distance so the dollar loss on a failed trade is a fixed percentage of the trading account. Doing this first prevents the common error of letting the chart talk the trader into a position that is too large.
Step 2 — Check Trend Structure (20/50/200 EMA)
Confirm the 20-day EMA sits above the 50-day, the 50-day sits above the 200-day, and the slopes are positive. If the structure is not bullish, downgrade the trade to a lower-conviction setup or pass. A clean trend structure is the filter that separates high-quality entries from coin-flip ones.
Step 3 — Check Volume and OBV
On the trigger day, require volume at least 1.5x the 20-day average. Confirm OBV is rising in the same direction as price. If either condition fails, wait for the next session. A move that has to fight volume rarely produces a clean follow-through, and the cost of waiting one bar is usually much smaller than the cost of being wrong.
Step 4 — Check Momentum (MACD and RSI)
Look for a bullish MACD crossover or a histogram turning positive. Confirm RSI is above 50 for long setups, or watch for a bullish divergence at the pullback low. If momentum is rolling over, the trade is not yet confirmed, no matter how good the price action looks. A close above resistance while the MACD histogram is shrinking is one of the most common false-breakout signatures.
Step 5 — Check Relative Strength Against SPY (and the Sector ETF)
Plot the stock-to-SPY ratio and confirm it is rising or at a new high. Cross-check the stock-to-sector-ETF ratio. If the stock is leading both, the setup is fully confirmed. If it is lagging the sector, downgrade or pass. If it is leading the sector but lagging SPY, the trade is borderline — usually worth a smaller size rather than a full position.
If all five checks pass, the trade is taken with a pre-defined stop at the invalidation level. If only three of five pass, the trade is either skipped or sized at half a normal position. That rule is what keeps the strategy from drifting when a hot name is running.
Practical Tips for Better Results
Wait for the daily close before acting. Intraday noise routinely produces signals that fail by the close. A daily close above resistance is a meaningfully different event from an intraday poke above it.
Use a higher timeframe for the trend and a lower timeframe for the entry. A pullback setup on the daily is best entered on a 1-hour or 30-minute confirmation, not on a 5-minute scalp where noise dominates.
Keep the signals independent. If two indicators are both derived from the same data, they are not independent confirmations. They are one confirmation counted twice. Volume, momentum, trend, and relative strength pull from different inputs.
Apply the same checklist to both sides. Confirmation works for short setups as well as long ones. The mirror rules — 20/50/200 stacked bearish, RS line at new lows, MACD bearish crossover, and OBV declining — are how disciplined traders also short.
Re-confirm after earnings. A stock that passes all five checks and then reports earnings will reset every indicator on the chart. Treat the next session as a new setup and re-run the stack from scratch.
Size by stop distance, not by conviction. The most common error is to take a full position on a low-conviction setup and a half position on a high-conviction one. Position size should be inversely proportional to stop distance so the dollar risk is constant.
Keep a written rule for what counts as confirmation. If the rule is not written, it will be quietly relaxed the next time a hot name is running and the trader is afraid of missing the move.
Common Mistakes to Avoid
Buying a breakout on the first five-minute candle. Early-morning volume is rarely representative. Wait for the daily close to confirm participation and structure.
Treating one indicator as enough. Any single signal can fail. The point of the stack is that it fails less often, not that any one piece is reliable on its own.
Ignoring relative strength. Stocks can rally and still underperform. Buying laggards in a strong tape is one of the surest ways to underperform the index even while being “right” on direction.
Skipping the stop calculation. A confirmed trade with no defined invalidation is just a hope with a position size attached.
Re-optimizing the rules after two losses. Confirmation systems are statistical, not deterministic. Two losses in a row do not invalidate a five-signal stack. They are part of the cost of using it.
Letting the news do the confirming. A great earnings story is not the same as a confirmed chart. Let the price action and indicators do the confirming, then read the news to see whether the move has fundamental support behind it.
What are the best confirmation signals for trading US stocks
The signals most consistently cited by active US-equity traders are volume expansion (price breaking out on 1.5x to 2x average volume with rising On-Balance Volume), moving-average structure (20/50/200-day EMAs stacked in trend direction), momentum (MACD crossover and RSI holding above 50 or printing a bullish divergence), and relative strength versus SPY. Used together, they form a multi-dimensional confirmation stack that is more reliable than any one indicator on its own.
How do confirmation signals reduce false breakouts
A false breakout is essentially a price move that lacks participation. Confirmation signals filter for participation by requiring volume expansion, momentum agreement, and relative strength. When several independent inputs agree, the statistical probability of follow-through rises, and the probability of a stop-out falls. The signals do not eliminate false breakouts — no method can — but they reduce their frequency enough to shift the expectancy of the strategy.
Which technical indicators confirm a stock breakout the most reliably
Volume and relative strength are the two highest-yield confirmations. A breakout on 2x average volume is more likely to extend, and a breakout where the stock-versus-SPY ratio is also at a new high confirms that the leadership is real. MACD and the 20/50/200 EMA stack add useful but secondary layers. The least reliable on their own are pattern-based indicators like candlestick formations, which describe shape but not participation.
When should a trader wait for confirmation before buying a stock
Confirmation is most valuable when the risk of a false move is high. That includes breakouts after a long basing period, pullbacks to a moving average in a still-intact uptrend, and any setup that has failed once already. In strongly trending markets with broad participation, the cost of waiting for confirmation is that the trader enters later. In choppy or low-volume markets, the cost of not waiting is a stop-out and a smaller account.
Can confirmation signals work for day trading and swing trading alike
The principles are the same. The inputs are not. Day traders use intraday volume profiles, 5-minute and 15-minute EMAs, and real-time relative strength. Swing traders use daily volume, 20/50/200-day EMAs, and end-of-day RS lines. Both timeframes benefit from requiring multiple independent confirmations before entry. The mistake is to apply daily indicators to a five-minute chart or vice versa, where the noise-to-signal ratio collapses.
Is volume confirmation more reliable than price action alone
Historically, volume is one of the few inputs that adds information that price alone does not. Two breakouts to the same price level can have very different outcomes depending on whether volume is 0.8x or 2.3x the average. That said, volume is not a magic indicator on its own. It is most reliable as one input in a stack that also includes trend structure, momentum, and relative strength. Used alone, it can still be fooled by short-term news spikes and end-of-day rebalancing flows.
Conclusion
Confirmation is not a signal. It is a discipline. The five-signal stack — built on volume, EMA structure, momentum, relative strength, and volatility compression — turns a chart pattern from a guess into a probability. Most of the edge in swing trading comes from the simple act of not entering until the market has said yes more than once.
A practical next step is to pick three US large-cap names, run them through the checklist on the daily chart for the last fifty trading sessions, and journal which setups would have triggered and which would not. After fifty setups, the trader will have a working read on the signal stack’s hit rate, average move, and average loss — all without risking a dollar of live capital.
Risk disclosure: All trading involves the risk of loss. Past performance of any signal or strategy does not guarantee future results. Confirmation systems reduce the frequency of losing trades but cannot eliminate them. Position sizing, stop placement, and overall portfolio risk should always be set before a trade is taken, and traders should never risk capital they cannot afford to lose.
—
This article is for educational purposes only and does not constitute investment advice. Trading and investing carry risk of loss; never invest more than you can afford to lose. Last reviewed: August 2026.