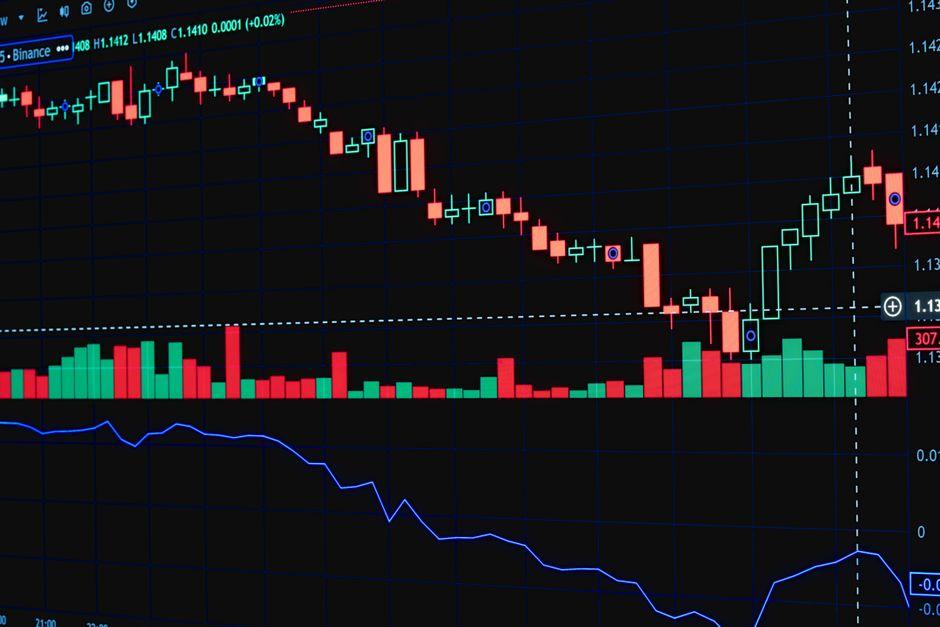
Advanced Pullback Execution Rules for Strong Trend Traders

Table of Contents
- Introduction
- What Is Advanced Pullback Execution
- Why Advanced Pullback Execution Matters for Traders and Investors
- Core Concepts
- Step‑by‑Step Guide
- Practical Tips for Better Results
- Common Mistakes to Avoid
- Frequently Asked Questions
- Conclusion
Introduction
When the S&P 500 vaulted 5 % in early April 2024, a wave of retail day‑traders rushed in, hoping to ride the surge. Within minutes the index retreated to the 0.618 Fibonacci retracement near 4,200, erasing roughly half of the day’s gains for those who entered on impulse. At the same time, disciplined participants who had anchored their entries to the same geometric level captured the remainder of the move with minimal drawdown.
If you have ever taken a pullback only to watch the price resume its climb and then flip, you know the sting of a mistimed entry and a stop that gets trampled. The issue is rarely a lack of momentum; more often it is the absence of a repeatable framework that ties entry, risk, and exit to the underlying trend’s strength.
This piece unpacks the advanced pullback execution methodology—a set of rules that let you harvest the tail of a strong move while keeping downside exposure tight. We will walk through dynamic Fibonacci zones, multi‑timeframe EMA filters, and VWAP‑volume divergence, then illustrate the process with two live‑market case studies from futures and forex. By the end, you should be able to apply the three‑filter checklist to any liquid market that is trending with conviction.
What Is Advanced Pullback Execution?
Advanced pullback execution is a systematic, rule‑based approach to entering a market that is already in a high‑momentum trend after it briefly retraces toward a pre‑identified support or resistance zone. The method goes far beyond a simplistic “buy the dip.” It layers three distinct filters—price geometry, moving‑average alignment, and order‑flow cues—to confirm that the pullback is a temporary concession rather than a genuine reversal.
In the April 2024 S&P 500 futures trade, the price fell from a fresh high of 4,260 to the 0.618 Fibonacci retracement at 4,200. A limit order placed just inside that zone was filled only after two conditions were met: the 20‑day EMA remained above the 50‑day EMA on both the daily and 15‑minute charts, and the VWAP showed buying pressure through a positive volume‑delta divergence. Those confirmations signaled that the broader uptrend remained intact, allowing the trader to capture the remaining 60‑point swing with a risk‑reward profile that comfortably exceeded 2:1.
Why Advanced Pullback Execution Matters for Traders and Investors
Professional prop desks and systematic funds have long harvested pullbacks to improve position‑averaging, lower execution costs, and boost overall portfolio efficiency. Retail traders who skip the extra layers of confirmation often suffer from premature entries, oversized stops, and a drag on risk‑adjusted returns.
When a market is locked in a strong trend—whether it is a commodity rally spurred by the Federal Reserve’s policy stance or a currency pair buoyed by divergent ECB and Fed rate expectations—price tends to respect geometric retracement levels. By anchoring entries to those levels and layering EMA, VWAP, and volume‑delta signals, you align your trade with the same forces that are moving the market. Ignoring these rules can turn a high‑probability setup into a whipsaw, eroding capital and confidence.
Dynamic Fibonacci Retracement Zones — geometry meets momentum
Fibonacci ratios (0.382, 0.618, 0.786) are static on paper, but in a strong trend they should be recalculated on each swing high and low to reflect the evolving price swing. The “dynamic” aspect means you redraw the zones as the trend extends, keeping the retracement levels relevant to the most recent price action.
In the July 2023 EUR/USD example, the bullish swing from 1.0700 to 1.1150 generated a 0.618 retracement at 1.0950. Rather than using a fixed level from an older swing, the trader recomputed the zone after the price broke the prior high, ensuring the entry point sat at the most current support. The dynamic zone acted as a “price magnet” that attracted buying when volume confirmed absorption.
Multi‑timeframe EMA Cross Filter — trend‑aligned confirmation
Exponential moving averages smooth price while preserving recent data. Using a short‑term EMA (e.g., 20‑period) and a longer‑term EMA (e.g., 50‑period) on two timeframes—say, 15‑minute and 1‑hour—creates a cross filter that validates trend direction across horizons.
During the S&P 500 pullback, the 20‑EMA on the 15‑minute chart remained above the 50‑EMA, while the 1‑hour chart showed the same alignment. This dual‑timeframe confirmation reduced the likelihood of a false bounce that could appear on a single timeframe due to micro‑structure noise.
VWAP and Volume‑Delta Divergence — liquidity validation
The volume‑weighted average price (VWAP) reflects the average price weighted by traded volume, acting as a benchmark for institutional participation. A divergence between price and volume delta (the net difference between buying and selling volume) signals whether liquidity is supporting the move.
In the EUR/USD trade, price touched the 20‑EMA pullback level while VWAP stayed above it, and the volume delta turned positive, indicating that buyers were stepping in at or near the VWAP. This divergence suggested that the pullback was being absorbed rather than amplified, giving the trader confidence to go long.
Core Concepts
## 1. Identifying the prevailing trend
The first step is to step up to a higher‑timeframe chart—daily for equities, 4‑hour for forex, or weekly for commodities—to confirm the market’s direction. A series of higher highs and higher lows on the daily chart, or a clear upward bias on the 200‑day EMA, signals a bullish environment. Conversely, a descending channel and a 20‑EMA below the 50‑EMA on the weekly chart would flag a downtrend.2. Redrawing dynamic Fibonacci zones
Once the trend is confirmed, locate the most recent swing high and swing low. Compute the 0.382, 0.618, and 0.786 retracement levels. As the price makes new highs (in an uptrend) or new lows (in a downtrend), shift the swing points and recompute the zones. This keeps the geometry in lockstep with the market’s momentum.
3. Applying the multi‑timeframe EMA cross filter
Switch to a lower‑timeframe chart—15‑minute for futures, 30‑minute for forex. Plot a 20‑EMA and a 50‑EMA. Verify that the short EMA sits above the long EMA on both the lower‑timeframe and an intermediate timeframe (e.g., 1‑hour). The double‑layered filter weeds out noise that can mislead a single‑timeframe view.
4. Validating liquidity with VWAP and volume‑delta divergence
Overlay VWAP on the same lower‑timeframe chart. Observe whether price is bouncing off VWAP while the volume delta turns positive (more aggressive buying than selling). A positive divergence confirms that institutional participants are stepping in, reinforcing the pullback’s temporary nature.
5. Position sizing and stop placement using ATR
Calculate the Average True Range (ATR) over the past 14 periods on the lower‑timeframe. Multiply the ATR by a factor—commonly 1.5—to size the stop‑loss distance below the entry point. Adjust the multiplier for market volatility: tighten to 1 × ATR when VIX is low, expand to 2 × ATR during high‑volatility sessions. The profit target is typically the prior swing high (for long trades) or the prior swing low (for shorts), or the next Fibonacci extension level.
Step‑by‑Step Guide
Step 1 — Identify the prevailing trend and redraw dynamic Fibonacci zones
Begin with a higher‑timeframe chart (daily for equities, 4‑hour for forex) to confirm the market’s direction. Mark the most recent swing high and low, then calculate the 0.382, 0.618, and 0.786 levels. As the price makes new highs, shift the swing points and recompute the zones.
Example: A trader watching the CME S&P 500 futures contract notes a swing low at 4,050 and a swing high at 4,260. The 0.618 retracement lands at 4,200, which becomes the primary entry zone for a pullback trade.
Step 2 — Apply the multi‑timeframe EMA cross filter for entry confirmation
Switch to a lower timeframe (15‑minute for futures, 30‑minute for forex). Plot a 20‑EMA and a 50‑EMA. Verify that the short EMA sits above the long EMA on both the lower and an intermediate timeframe (e.g., 1‑hour). Only when both align should you consider the pullback valid.
Example: In the EUR/USD scenario, the 20‑EMA on the 30‑minute chart was at 1.0945, the 50‑EMA at 1.0920, and the 1‑hour chart showed the same hierarchy. The cross filter cleared the entry.
Step 3 — Validate liquidity with VWAP and volume‑delta divergence, then place ATR‑based stop‑loss and target
Overlay VWAP on the same lower‑timeframe chart. Look for price to bounce off VWAP while the volume delta turns positive. Once confirmed, enter with a limit order just inside the Fibonacci zone. Compute the ATR over the past 14 periods; set the stop‑loss a multiple (e.g., 1.5 × ATR) below the entry, adjusted for the zone’s depth. Target the next logical resistance—often the prior swing high or a higher Fibonacci level.
Example: In the S&P 500 trade, the ATR (14) was 12 points. The trader placed the stop 18 points (1.5 × ATR) below the entry at 4,180. The profit target was set at the prior high of 4,260, yielding a risk‑reward ratio near 2.5:1.
Practical Tips for Better Results
– Scale in gradually. If the price stalls at the zone, consider adding a second half‑size position when the volume delta strengthens further. Scaling reduces the impact of a single entry point and lets you ride a smoother price curve.
– Watch the order‑flow block. Large hidden orders reported in the CFTC’s Commitment of Traders (COT) data can create a “block” that absorbs pullbacks. Avoid entering when the block expands, as it may signal a pending reversal.
– Adjust the ATR multiplier to market regime. In low‑volatility environments—VIX below 15, for instance—tighten the stop to 1 × ATR. In high‑volatility sessions, such as after a Federal Reserve announcement, use 2 × ATR to avoid premature exits.
– Leverage market‑on‑close (MOC) data. For equities, the end‑of‑day VWAP can confirm that institutional flow supports the pullback. A strong MOC VWAP above the entry zone adds another layer of confidence.
– Correlate with related futures. A robust move in Nasdaq‑100 futures often precedes S&P 500 pullbacks; aligning entries accordingly can improve timing.
– Maintain a trade journal. Record zone calculations, EMA cross times, and volume‑delta readings. Over months, patterns emerge that allow you to fine‑tune the rule set and improve edge.
Common Mistakes to Avoid
– Entering without EMA alignment. A single‑timeframe EMA cross can be fooled by micro‑structure noise, leading to false entries. Always require dual‑timeframe confirmation.
– Setting stops too tight relative to ATR. Stops placed inside the natural volatility envelope increase the chance of being stopped out before the trend resumes. Use the ATR‑based approach to keep stops realistic.
– Ignoring dynamic zone updates. Relying on stale Fibonacci levels causes entries at irrelevant price points, eroding the geometric advantage. Recalculate zones after each swing extension.
– Overlooking volume‑delta signals. Price alone may bounce, but without buying pressure the move is likely to reverse. Volume‑delta divergence is the liquidity litmus test.
– Using market orders in illiquid contracts. In thinly traded futures, market orders can suffer slippage that erodes the risk‑reward profile. Limit orders inside the zone protect against adverse fills.
How do I execute an advanced pullback in a strong uptrend?
First, confirm the uptrend on a higher timeframe, then redraw dynamic Fibonacci zones based on the latest swing. Apply a multi‑timeframe EMA cross filter to ensure the short EMA stays above the long EMA on both low and intermediate charts. Validate the bounce with VWAP and a positive volume‑delta divergence before placing a limit order inside the zone, and set an ATR‑based stop below the entry.
What indicators confirm a high‑probability pullback entry?
A combination of dynamic Fibonacci retracement, EMA cross alignment across two timeframes, VWAP positioned above the entry price, and a turning positive volume delta provides a strong confirmation. Adding the ATR for stop sizing completes the risk framework.
Why do pullbacks sometimes fail during a strong trend?
Failure often stems from a shift in market sentiment—such as unexpected macro news or a sudden change in order‑flow imbalance—that converts the retracement into a reversal. Inadequate confirmation (e.g., missing EMA alignment or weak volume‑delta) also leaves the trade vulnerable to whipsaws.
When should I tighten stops on an advanced pullback trade?
If the ATR contracts sharply, indicating a low‑volatility environment, or if the price moves favorably and the EMA distance widens, you can tighten the stop to lock in profit. Conversely, during a volatile news release, widening the stop to 2 × ATR may prevent premature exits.
Can advanced pullback rules be applied to futures contracts?
Yes. Futures such as CME S&P 500, E‑mini, or crude oil have deep liquidity and transparent order‑flow data, making them ideal for VWAP and volume‑delta analysis. The same dynamic Fibonacci and EMA cross principles apply, with adjustments for contract‑specific tick size and margin requirements.
Is advanced pullback execution suitable for beginners?
The framework is systematic, but it demands familiarity with multiple technical tools and an understanding of market microstructure. Beginners should practice the rules on a simulated platform, start with small position sizes, and focus on discipline before scaling up.
Conclusion
The single most important lesson is that a pullback becomes a tradeable opportunity only when price geometry, trend alignment, and liquidity signals all point to a temporary concession rather than a reversal. Begin by mapping dynamic Fibonacci zones on a higher timeframe, then filter entries with multi‑timeframe EMA crosses and VWAP‑volume divergence, and finally size your stop using ATR.
Your next step: open a chart of a liquid future, draw the latest swing points, and run a single test trade using the three‑filter checklist. Remember, no rule eliminates loss—always size positions to withstand a worst‑case move and respect the stop‑loss you set. Trading responsibly is the foundation of any sustainable edge.
—
This article is for educational purposes only and does not constitute investment advice. Trading and investing carry risk of loss; never invest more than you can afford to lose.
Last reviewed: August 2026