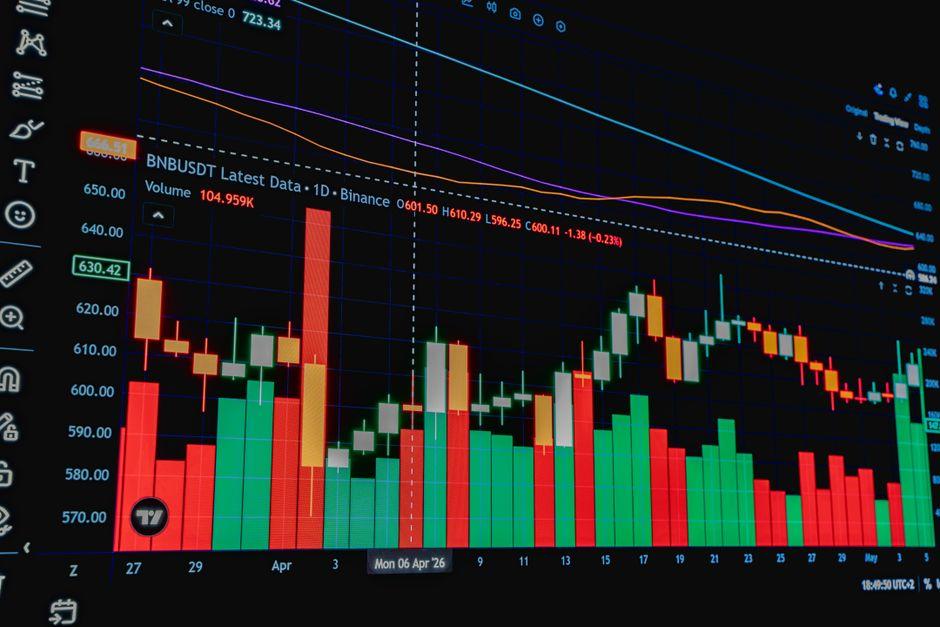
Price Action Trading Basics: Pin Bars, Engulfing & Inside Bars

Table of Contents
- Introduction
- What Is Price Action?
- Why Price Action Matters for Traders and Investors
- Core Concepts
- Step-by-Step Guide
- Practical Tips for Better Results
- Common Mistakes to Avoid
- Frequently Asked Questions
- Conclusion
Introduction
Picture a trader monitoring S&P 500 futures during a high-impact Federal Reserve press conference. The price spikes aggressively, breaching a well-established resistance level, only to snap back and close near the session low within a matter of minutes. Most retail traders, tethered to a lagging MACD or a smoothed moving average, would still see a bullish trend and likely buy the breakout. Meanwhile, the professional trader recognizes a fakeout—a clear signal that liquidity was grabbed and the trend is reversing.
The fundamental problem for most investors is a dependency on indicators that merely recalculate past price data. By the time a crossover occurs, the primary move is often exhausted, leaving the trader to enter at the worst possible price. This creates a persistent disconnect between the chart and the actual order flow. Understanding price action allows you to observe the battle between buyers and sellers in real-time, stripping away the noise and focusing on the only variable that actually moves a market: price.
This guide explains how to read raw market psychology through three specific candlestick patterns: the Pin Bar, the Engulfing candle, and the Inside Bar. You will learn how to identify these signals, combine them with market structure, and execute trades based on empirical evidence rather than hope.
What Is Price Action?
Price action is the study of the raw movement of an asset’s price over time, devoid of mathematical overlays or lagging indicators. It is the disciplined practice of analyzing the relationship between price, time, and volume to determine the current market regime and the most likely future direction.
Consider a scenario where a stock has been trending upward for several weeks but suddenly prints a series of candles with long upper wicks at a historical psychological level, such as $100. Price action analysis suggests that buyers are exhausted and sellers are aggressively stepping in. In this instance, the trader is not looking at an RSI reading or a stochastic divergence; they are observing the actual failure of the market to push higher.
At its core, price action is about reading the narrative of the tape. It treats the chart as a map of human emotion—fear, greed, and indecision—expressed through the bid-ask spread and the resulting candle closes.
Why Price Action Matters for Traders and Investors
Most technical indicators are derivatives of price. A moving average is simply the mean of past prices; a stochastic oscillator is a formula based on the range of the last few bars. When you rely on these, you are viewing a filtered, delayed version of reality. Price action is the source code.
Institutional players, including hedge funds and high-frequency trading firms, do not execute multi-million dollar positions based on a 14-period RSI. They trade based on liquidity, order flow, and key price levels. By mastering price action, you align your analysis with the participants who actually move the needle in the global markets.
Ignoring price action often leads to entering a trade just as the momentum is ending. You might buy a bullish crossover at the exact moment a large institutional seller is distributing their position into the buying pressure. Conversely, understanding price action allows you to identify high-reward, low-risk entries where your stop loss is placed behind a clear structural failure. This approach significantly reduces potential drawdowns and improves the overall expectancy of a trading system.
Pin Bar: Identifying False Breakouts and Rejection
A pin bar is a candlestick characterized by a small body and a long wick, or tail, that protrudes significantly from one side. This structure represents a failed attempt by the market to push price in one direction, followed by a violent rejection.
The underlying mechanism here is often a liquidity grab. Price moves into a zone where many stop-loss orders are resting. Once those orders are triggered, the market finds a pocket of high-volume opposite interest and reverses sharply.
Example: Consider a Daily EUR/USD chart where price is descending toward a major support level. The candle opens, drops deep into the support zone, but then recovers almost all of those losses to close near the top of the range. This bullish pin bar signals that the bears attempted to push the market lower, failed, and the bulls have now seized control. A professional trader would look for an entry on the close of this bar, placing a stop loss just below the tip of the wick to protect against a further breakdown.
Engulfing Patterns: Measuring Momentum Shifts
An engulfing pattern occurs when a candle completely swallows the body of the previous candle. This is a sign of a sudden and powerful shift in sentiment. While the pin bar shows a rejection, the engulfing candle demonstrates a complete takeover of the market by the opposing force.
In a bearish engulfing scenario, a small green candle is followed by a massive red candle that opens above the previous close and closes below the previous open. This indicates that the buyers were completely overwhelmed by a surge of selling pressure, often triggered by a change in valuation or a macroeconomic catalyst.
Example: Imagine S&P 500 futures rallying into a psychological resistance level during a distribution phase. The market prints a small bullish candle, suggesting a brief pause. Suddenly, a large bearish candle forms, engulfing the previous bar and closing deep into the previous day’s range. This shift in momentum suggests that the rally has run out of steam and institutional selling has entered the fray. The trade is not just about the pattern, but the location; an engulfing candle in the middle of a range is noise, but at a key resistance level, it is a high-probability signal.
Inside Bars: Trading Volatility Contraction and Breakouts
An inside bar is a candle whose entire range, from high to low, is contained within the range of the previous candle, known as the mother bar. This represents a period of consolidation and volatility contraction.
Markets move in cycles of expansion and contraction. The inside bar is the contraction phase. It signals that the market is undecided and is building energy for the next move. Trading the inside bar is not about guessing the direction, but about trading the breakout of the mother bar’s range.
Example: A stock is in a strong uptrend but then prints two or three inside bars. This indicates a temporary equilibrium where neither buyers nor sellers can push the price further. The trader marks the high and low of the mother bar. When price finally breaks and closes above the mother bar’s high, it signals that the equilibrium has broken in favor of the bulls. This is often a lower-risk entry because the coiling effect of the inside bar often leads to a rapid expansion in price, providing a quick move toward the profit target.
Step-by-Step Guide
Step 1 — Identify the Market Regime and Context
Before searching for a pin bar or an engulfing candle, you must determine the broader environment. Are you in a trending market or a ranging market? A bullish pin bar in a strong downtrend is often just a temporary pause before further declines. However, a bullish pin bar at the bottom of a downtrend, coinciding with a major support zone, is a potent reversal signal.
Identify your Area of Value. This is a zone where price has historically reacted—such as a previous swing high, a round number, or a long-term moving average. Do not trade patterns in the middle of nowhere. A pattern without context is merely a random fluctuation of price.
Step 2 — Wait for the Pattern to Close
The most common mistake beginners make is trading a candle while it is still forming. A candle can look like a pin bar for 59 minutes and then close as a full-bodied bullish candle in the final minute, completely changing the signal.
Wait for the candle to close on your chosen timeframe. If you are swing trading on the Daily chart, the signal is only valid after the New York close. If you are day trading on the 15-minute chart, wait for the bar to finalize. The close is the only definitive piece of data; everything else is just a temporary fluctuation of the bid-ask spread.
Step 3 — Define Your Risk and Execution
Once a valid pattern forms at an Area of Value, determine your exit points before entering the trade.
For a pin bar, the logical stop loss is placed a few pips or ticks beyond the end of the wick. For an engulfing candle, the stop is typically placed above the high of the engulfing bar for shorts, or below the low for longs.
Calculate your position size based on the distance to your stop. If your stop is wide, reduce your lot size to ensure you only risk a small percentage, such as 1%, of your account equity. Aim for a risk-reward ratio of at least 1:2. If the distance to the next major structural level does not allow for this ratio, pass on the trade. Professional trading is as much about the trades you do not take as the ones you do.
Practical Tips for Better Results
Combine patterns with confluence. A pin bar is a good signal; a pin bar that hits a 61.8% Fibonacci retracement level and a psychological round number is a high-probability trade. The more independent reasons you have to take a trade, the higher the probability of success.
Focus on the wick of the story. Long wicks always indicate a struggle for control. The longer the wick, the more violent the rejection and the more significant the shift in sentiment.
Trade the higher timeframes first. A 1-hour pin bar is significant, but a Weekly pin bar can dictate the trend for the next three months. Always align your lower-timeframe trades with the higher-timeframe trend to avoid trading against the dominant market force.
Watch for clusters. If you see an inside bar followed by a pin bar, the market is signaling extreme indecision followed by a sharp rejection. This sequence is often more powerful than a single isolated candle.
Use a hard stop always. Price action can be volatile, and slippage occurs during high-volatility events, such as NFP or CPI releases. A hard stop prevents a single trade from causing a catastrophic drawdown that could wipe out weeks of gains.
Observe the speed of the move. A slow, grinding move into a support level followed by a fast, sharp pin bar rejection is more reliable than a slow, drifting pin bar. Speed indicates conviction.
Common Mistakes to Avoid
Trading patterns in isolation is a primary cause of failure. A pin bar in the middle of a chart means nothing. It only gains meaning when it interacts with a level of support or resistance.
Over-trading the Inside Bar is another frequent error. Many traders enter as soon as the inside bar forms. The correct approach is to wait for the break of the mother bar’s range to confirm the direction of the breakout.
Ignoring the trend can be fatal. Trying to pick a top with a single bearish engulfing candle during a parabolic bull run is a recipe for loss. The trend is your shield; do not fight it without overwhelming evidence of a structural shift.
Revenge trading after a fakeout is a psychological trap. Price action is probabilistic, not deterministic. A pin bar can fail. If it does, accept the loss and wait for the next setup rather than doubling down to recover losses.
Using too many timeframes often leads to analysis paralysis. Switching between 1-minute, 15-minute, and Daily charts can result in seeing a bullish signal on one and a bearish signal on another. Pick two timeframes—one for the overall trend and one for the specific entry.
How do I start price action trading for beginners?
Start by removing all indicators from your charts. Spend a few weeks simply identifying support and resistance levels on a Daily chart. Once you can see where price consistently turns, begin looking for the three patterns mentioned here only at those specific levels. Practice on a demo account or with small size to build a visual library of how these patterns behave before and after the signal.
What is the difference between price action and technical analysis?
Technical analysis is a broad umbrella that includes everything from chart patterns and indicators to Elliott Wave theory and Ichimoku Clouds. Price action is a specific subset of technical analysis that focuses exclusively on the movement of price. While a technical analyst might use a Bollinger Band to identify volatility, a price action trader looks at the range of the candles and the speed of the move to reach the same conclusion.
Why is price action better than using indicators?
Indicators are lagging; they tell you what happened in the past by averaging previous data. Price action is leading; it tells you what is happening right now. By reading the raw candles, you can spot a reversal the moment it happens, whereas an indicator may take several bars to confirm the move, by which time the best risk-reward entry has already passed.
When is a pin bar considered a valid signal?
A pin bar is valid when it occurs at a significant structural level, such as support, resistance, or a trendline, and has a tail that is at least two to three times the size of the body. The tail must clearly penetrate a level and then be rejected. If the pin occurs in a vacuum with no nearby support or resistance, it is generally considered noise.
Can price action be used on all timeframes?
Yes, price action is fractal, meaning the same patterns appear on 1-minute charts and Monthly charts. However, the reliability increases with the timeframe. A pin bar on a 5-minute chart is often the result of a single large order; a pin bar on a Daily chart represents the collective decision of thousands of traders over a full session.
Is price action trading risky for new investors?
All trading involves the risk of loss. Price action reduces risk by providing clear, logical points for stop losses, but it does not eliminate it. New investors are prone to seeing patterns where none exist, a phenomenon known as pareidolia. The risk is managed not by the pattern itself, but by strict position sizing and a disciplined approach to risk-reward ratios.
Conclusion
The core of successful trading is not finding a magic indicator, but understanding the psychology of the participants. Price action allows you to see where buyers are exhausted and where sellers are trapped. Whether it is the rejection of a pin bar, the momentum of an engulfing candle, or the tension of an inside bar, these patterns are the footprints of institutional money.
The most practical next step is to open a chart of a major asset—such as the S&P 500 or EUR/USD—and go back through the last six months of data. Mark every pin bar and engulfing candle that occurred at a major support or resistance level. Note how many of them led to a move in the predicted direction and how many failed. This process of manual backtesting will build the conviction necessary to trade without a lagging indicator.
Remember that no pattern guarantees a profit. Trading is a game of probabilities. Always protect your capital with a stop loss and never risk more than you can afford to lose.
*
Disclaimer: Trading financial instruments involves significant risk of loss and is not suitable for all investors. Past performance is not indicative of future results. The analysis provided here is for educational purposes and does not constitute financial advice.
—
This article is for educational purposes only and does not constitute investment advice. Trading and investing carry risk of loss; never invest more than you can afford to lose.
Last reviewed: August 2026