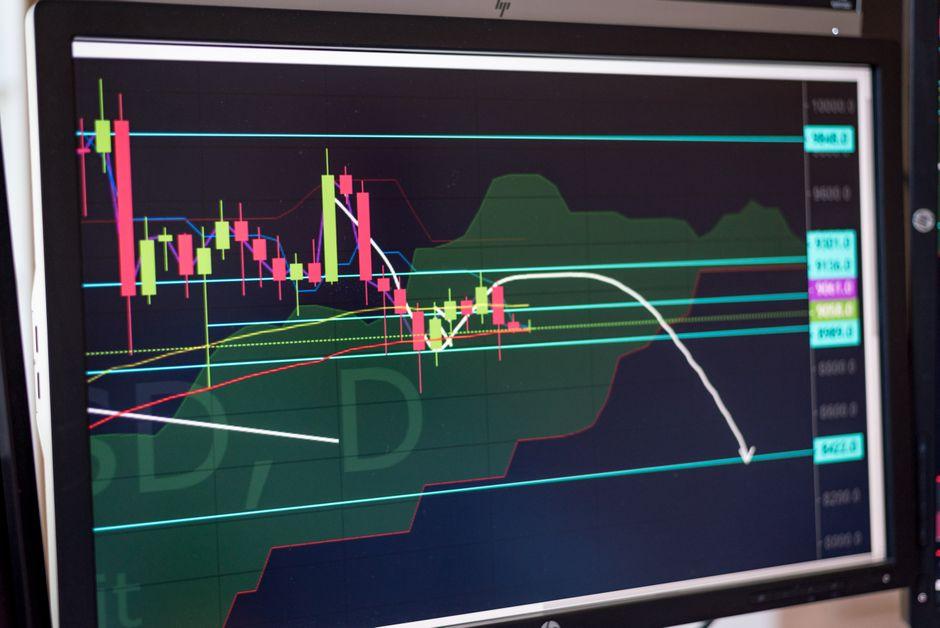
How Dynamic Support & Resistance Shift in Volatile Markets

Table of Contents
- Introduction
- What Is Dynamic Support and Resistance?
- Why Dynamic Support and Resistance Matters for Traders and Investors
- Core Concepts
- ATR‑Based Buffer Zones
- Volatility‑Adjusted Pivot Points
- Adaptive Trendline Algorithms
- Step‑By‑Step Guide
- Practical Tips for Better Results
- Common Mistakes to Avoid
- Frequently Asked Questions
- Conclusion
Introduction
When the Federal Reserve announced a surprise rate cut in June 2023, the S&P 500 jumped 1.2 % within minutes, while the VIX surged from 14 to 22. Day traders watching the SPY ETF saw a static support line torn apart, only to watch price rebound off a higher low moments later. The episode highlights a recurring dilemma: support and resistance drawn from a fixed look‑back period become irrelevant the instant volatility spikes.
Relying on immutable lines can leave a trader stopped out on a fleeting swing or cause a breakout to be missed because the framework is too sluggish. The remedy lies in recognizing that support and resistance are not static walls but moving thresholds that expand and contract with market turbulence. This piece walks through the mechanics, showcases real‑world applications, and delivers a systematic process you can start using today.What Is Dynamic Support and Resistance?
Dynamic support and resistance are price thresholds that automatically adjust to recent market volatility instead of staying fixed until a clear break occurs. Think of a 200‑day moving average that stretches or shrinks based on a volatility metric such as the Average True Range (ATR) or implied volatility.
A concrete illustration comes from the EUR/USD pair after the 2020 Brexit vote. In a low‑vol environment, the 1.2000 level acted as a firm ceiling for weeks. When volatility erupted, the same nominal price became a moving barrier that drifted upward, mirroring the larger swings traders were now experiencing.Why Dynamic Support and Resistance Matters for Traders and Investors
Prop desks, swing traders, and algorithmic funds all need a framework that survives regime shifts. In a tranquil market, static zones provide clean entry signals. During a stress event—whether a Fed decision, a geopolitical shock, or a sudden liquidity crunch—those zones can turn into false barriers, prompting premature exits or missed opportunities.
Ignoring dynamic adjustments can inflate drawdowns. A trader who places a stop just below a static support line during a high‑vol episode may see the stop triggered by a temporary dip, even though the underlying trend remains intact. By contrast, a dynamic approach keeps stops at a distance proportional to the current ATR, preserving capital while still guarding against genuine reversals.ATR‑Based Buffer Zones — mechanism explained
The Average True Range captures the average distance between high and low over a chosen period, reflecting recent volatility. Adding a multiple of the ATR to a recent low (for support) or subtracting it from a recent high (for resistance) creates a buffer that widens when markets are jittery and tightens when they settle.
Consider a day trader on SPY during the June 2023 Fed announcement. The 14‑day ATR reads 1.8 points, and the prior day’s low sits at 425.00. Applying a 1.5 × ATR buffer yields a dynamic support of 425.00 − (1.5 × 1.8) = 421.30. As the market spikes, the ATR climbs to 3.2, pushing the support down to 420.20 and granting the trader extra room before a stop would be hit.Volatility‑Adjusted Pivot Points — mechanism explained
Traditional pivot points use the prior period’s high, low, and close to generate static levels. Volatility‑adjusted pivots replace the simple arithmetic mean with a factor derived from the ATR or implied volatility of a related instrument (for equities, the VIX often serves this role). The adjustment scales the distance between pivots in line with market stress.
A swing trader on EUR/USD after the Brexit vote sets the prior day’s high at 1.2150, low at 1.1900, and close at 1.2025. The 10‑day ATR on the pair is 0.0120. Applying a volatility multiplier of 2, the first‑level resistance becomes 1.2025 + (2 × 0.0120) = 1.2265, rather than the static 1.2150. The trader then places a profit target just below this adjusted resistance, anticipating that heightened volatility will push price toward the new level.Adaptive Trendline Algorithms — mechanism explained
Traditional trendlines connect two or more swing points, assuming a straight‑line relationship. Adaptive algorithms fit a regression line to recent price data while weighting each point by its volatility‑scaled confidence interval. When volatility spikes, the algorithm reduces the weight of outlier swings, preventing the trendline from being distorted by a single erratic move.
A quant desk monitoring Nasdaq‑100 futures (NQ) runs an adaptive least‑squares regression over the last 30 minutes, weighting each minute’s price by the inverse of its 5‑minute ATR. During a sudden earnings‑season rally, a single 2 % spike would normally tilt a static trendline upward, but the adaptive algorithm discounts that spike, keeping the trendline realistic and preserving the integrity of the resistance level derived from it.Step 1 — Choose the volatility metric and look‑back period
Select a volatility measure that matches your instrument’s liquidity profile. For equities and ETFs, the ATR over 14 periods is standard; for forex, a 10‑period ATR works well; for options‑heavy strategies, implied volatility from the VIX or a sector‑specific index may be more appropriate.
Step 2 — Calculate the dynamic buffer or multiplier
Decide on a multiplier that reflects your risk tolerance. A common choice is 1.5 × ATR for intraday trading, 2 × ATR for swing setups. For volatility‑adjusted pivots, a multiplier between 1.5 and 2.5 balances responsiveness with noise reduction.
Step 3 — Plot the dynamic levels on your chart
Using your platform’s drawing tools, overlay the calculated support and resistance. Many charting packages allow you to script the formula, so the lines update automatically as new bars close. Verify that the levels respect recent highs/lows and that they expand during high‑vol periods.
Step 4 — Align entry, stop, and target with the dynamic zones
Enter a long position when price rebounds off the dynamic support and shows a confirming candlestick pattern such as a bullish engulfing. Place the stop a few ticks below the support buffer to avoid being taken out by normal volatility. Set the profit target near the next dynamic resistance level, adjusting for expected move size based on the same volatility metric.
Step 5 — Monitor regime shifts and re‑calibrate
If the ATR or implied volatility changes by more than 30 % from the previous calculation, recompute the multiplier and redraw the zones. This ensures that your framework stays in sync with the market’s risk environment.
Practical Tips for Better Results
– Adopt a multi‑timeframe approach: confirm a dynamic support on a 5‑minute chart with the same level derived from a 30‑minute ATR to reduce false signals.
– Pair dynamic zones with volume analysis; a surge in volume at the dynamic support often confirms a genuine bounce.
– When the CFTC releases a Commitment of Traders report showing increased speculative positioning, expect higher volatility and widen your ATR multiplier accordingly.
– Guard against over‑fitting: a multiplier that is too high creates overly wide zones, turning every move into a “breakout” and eroding the edge.
– Test the method on a demo account across at least three market regimes—low, medium, and high volatility—to gauge its robustness.
– Incorporate a trailing stop that follows the dynamic support as it moves, preserving gains while respecting the evolving risk floor.Common Mistakes to Avoid
– Applying a single ATR period to all assets. Different markets have distinct volatility cycles; a one‑size‑fits‑all approach misrepresents risk.
– Setting stops exactly at the dynamic level. Minor price noise can trigger stops; give a buffer of 5‑10 % of the ATR.
– Ignoring liquidity constraints. In thinly traded stocks, the ATR may be inflated by a single outlier trade, leading to excessively wide zones.
– Failing to adjust the multiplier after major news. A static multiplier leaves you exposed when volatility spikes dramatically.
– Relying solely on dynamic levels without confirmation. Combine with price action, order flow, or macro cues to avoid false breakouts.How do dynamic support and resistance shift during high volatility?
When volatility rises, the ATR or implied volatility metric expands, causing the buffer multiplier to push support lower and resistance higher. The levels “stretch” to accommodate larger price swings, reducing the likelihood of premature stop‑outs.
What causes dynamic support and resistance levels to move?
The primary driver is a change in the underlying volatility measure—typically the ATR or implied volatility. Market events that alter liquidity, order flow, or risk perception (for example, Fed announcements or geopolitical shocks) cause the metric to adjust, which in turn moves the dynamic zones.
Why do static support lines break in volatile markets?
Static lines ignore the increased price range that accompanies high volatility. A sudden swing can breach a fixed level even though the broader trend remains intact, leading traders to interpret a normal fluctuation as a structural break.
When should traders adjust dynamic levels after a news event?
Re‑calculate the volatility metric as soon as the first post‑news bar closes. If the metric shifts by more than 20‑30 % from the prior value, update the multiplier and redraw the zones before entering new positions.
Can dynamic support and resistance improve trade entries?
Yes. By aligning entries with zones that reflect current market risk, traders can place entries closer to true price inflection points, potentially capturing larger moves while keeping stops at a sensible distance.
Is using ATR for dynamic levels risky?
ATR is a lagging indicator; it reflects past volatility, not future spikes. If a sudden event occurs after the ATR calculation, the buffer may be too narrow. Mitigate this risk by adding a safety margin or by using implied volatility for assets with fast‑moving options markets.
Conclusion
The key insight is that support and resistance must breathe with the market. By anchoring those levels to a volatility‑sensitive metric—whether an ATR buffer, a volatility‑adjusted pivot, or an adaptive trendline—you preserve the protective function of support while staying in the trade when price moves are merely noise.
Your next step: pick one instrument you trade regularly, compute a 14‑day ATR, apply a 1.5 × ATR buffer, and back‑test the resulting dynamic zones over the past six months. Adjust the multiplier as needed, then implement the framework on a small live account.
Remember, no method guarantees profit. Dynamic levels reduce the odds of being stopped out by temporary spikes, but they also widen your risk exposure. Size positions so that no single trade threatens more than a modest fraction of capital, and honor stop‑loss discipline. Trading responsibly remains the cornerstone of long‑term success.
—
This article is for educational purposes only and does not constitute investment advice. Trading and investing carry risk of loss; never invest more than you can afford to lose.
Last reviewed August 2026
Last reviewed: August 2026