

Wyckoff Re‑Accumulation: How to Add to Winning Trades Safely

The Wyckoff re‑accumulation phase offers a disciplined way to add to winners. This article walks through how to identify the spring, confirm the secondary test, and scale in with real‑world charts from AAPL and ES futures.

How Price Action Traders Spot Real vs Fake Trendlines
Distinguish real from fake trendlines with proven price‑action rules, learn how to confirm lines on multiple time‑frames, and avoid common pitfalls that trap many traders.

Using Market Profile Initial Balance to Predict Day Types
The first 60‑minute Initial Balance on a Market Profile chart often sets the tone for the entire session. This guide shows how to read that balance, classify day types, and apply the insight to stocks like AAPL and ES futures.
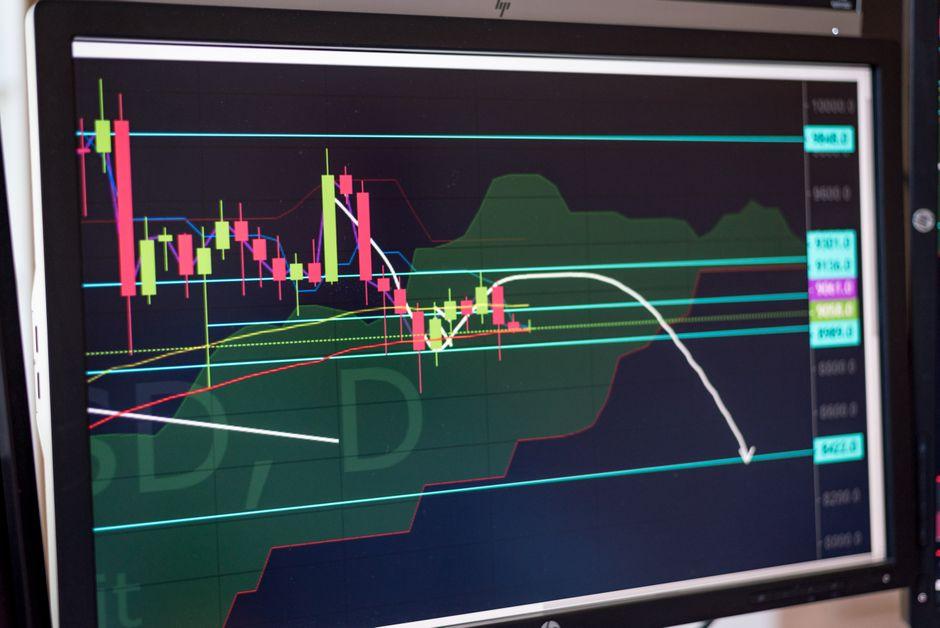
How Dynamic Support & Resistance Shift in Volatile Markets
Volatile markets can render static support and resistance useless. This guide shows how to make those levels adaptive using ATR buffers, volatility‑adjusted pivots, and algorithmic trendlines, with concrete examples for SPY and EUR/USD.

Swing High/Low Liquidity Mapping for Position Traders
Position traders who ignore swing high/low liquidity zones often miss the price reversals that drive multi‑week moves. This guide shows how to locate those zones, align them with order flow, and manage risk for better risk‑adjusted returns.

How Momentum Candles Reveal Institutional Drive Today
Momentum candles compress volume, price, and time into a single bar, letting traders glimpse institutional intent. This guide explains the core mechanics, real‑world examples, and practical steps to turn those signals into disciplined trades.

Identifying Absorption at Resistance Levels Using Order Flow
Spotting absorption at resistance can turn a stalled price move into a high‑probability entry. This guide breaks down the order‑flow signals, walks through real‑world examples, and offers a practical checklist for traders of any experience level.
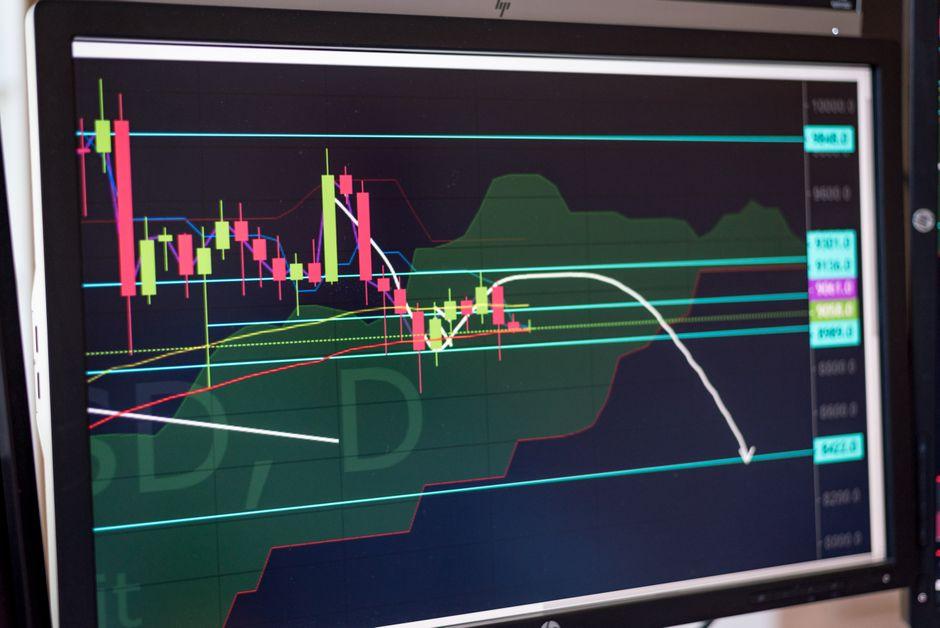
How Market Exhaustion Signals High‑Probability Pivots
Spotting market‑exhaustion patterns can reveal when a rally or decline is losing steam. This guide walks through the key signals, real‑world examples, and actionable steps to improve pivot timing.

Wyckoff Upthrust After Distribution: Execution Guide
The Wyckoff upthrust after distribution (UTAD) flags a false breakout that often flips into a sharp downside move. This guide shows how to identify the bar, confirm the trap, and manage the trade with real market examples.

How to Trade Inside Bar Breakouts with Controlled Risk
Inside‑bar breakouts offer a high‑probability entry when price compresses into a tight range. This guide shows how to capture those moves while keeping drawdowns in check, using real‑world forex and equity examples.

How Key Levels Shift During High‑Volume Trading Sessions
High‑volume sessions can rewrite the map of support and resistance in minutes. This guide explains the mechanics behind those shifts and offers a step‑by‑step method to adjust your key levels on the fly.

Advanced Engulfing Pattern Setups with Volume Confluence
Pairing advanced engulfing candles with strong volume signals can sharpen entry timing and improve win rates. This guide walks through the mechanics, real‑world examples, and disciplined steps to use the setup responsibly.

How to Map Complex Pullbacks vs Simple Pullbacks Guide
Distinguish and chart complex pullbacks from simple ones with a practical framework that blends Fibonacci clusters, multi‑timeframe moving averages, and VWAP‑OBV divergence. Real examples from AAPL and crude oil illustrate each step.

How Institutional Buying Appears on Footprint Charts
Footprint charts reveal the hidden hand of large institutions. This article breaks down the mechanics of order‑flow imbalances, delta spikes, and block‑trade clusters, showing traders how to read the footprints that often precede sharp moves.

How to Identify False Breakouts with Volume Spread Analysis
Volume Spread Analysis reveals hidden effort‑vs‑result imbalances that often precede fake breakouts. This guide walks you through the signals, a practical workflow, and the traps to avoid when trading volatile markets.
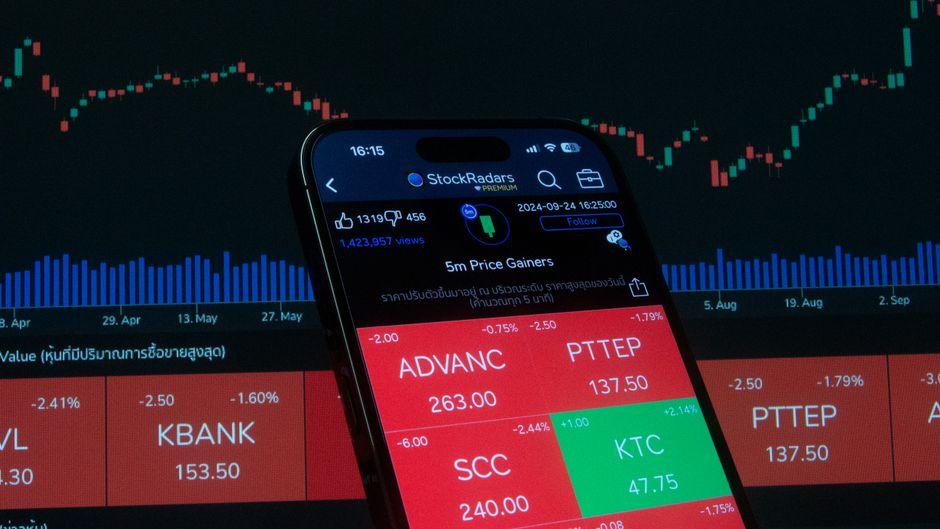
Trading Naked: A Pure Price‑Action Guide for Modern Traders
Stripping away every indicator forces traders to read the market’s pure language. This guide shows how to spot order‑flow imbalances, swing structures and liquidity pools for cleaner entries and exits.

How Point‑and‑Figure Charts Reveal True Market Trends
Point‑and‑figure charts discard time and focus solely on price movement, letting traders see trends that candlesticks often hide. This guide walks you through setting up the chart, reading patterns, and avoiding common pitfalls.

Point Control (POC) Trading Strategies for Day Traders
Day traders who ignore the point of control often miss the market’s most liquid price level. This article shows how to build a volume profile, read POC dynamics, and apply disciplined entry‑exit rules.

Auction Market Theory: VAH and VAL as Dynamic Zones
Value Area High (VAH) and Value Area Low (VAL) are the backbone of auction market theory, marking the zones where 68 % of trading activity clusters. This article breaks down their calculation, shows how elite traders use them for entries and exits, and…

How to Trade Range Expansion and Contraction Cycles
Capture profit from the rhythmic widening and tightening of price ranges with a hands‑on, risk‑controlled guide. Real‑world examples in stocks, forex, and crypto show how to spot expansion zones, manage stops, and avoid common pitfalls.

Structural Breakout Masterclass: Pair with CHoCH Signals
This masterclass dissects structural breakouts, shows how they differ from Change of Character signals, and provides a concrete workflow that blends both for tighter entries and clearer risk parameters.

How to Read Candlestick Wicks: Rejection vs Liquidity Grab
Candlestick wicks hide a story of price rejection or liquidity hunting. This guide shows how to read those wicks, spot the difference, and apply the insight to real‑world trades.
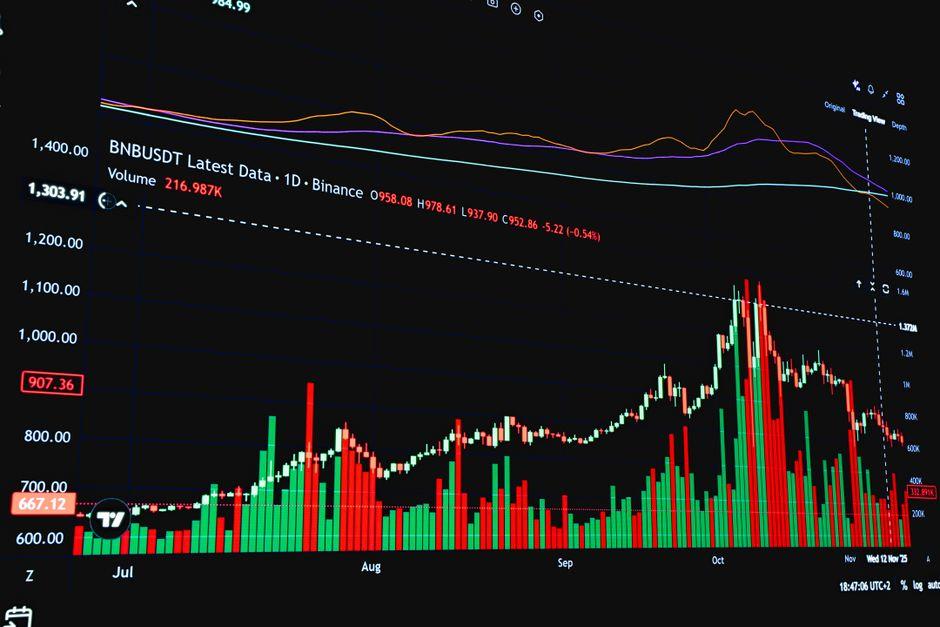
Volume Delta vs Price Action: Spot Hidden Reversals Fast
Blending volume delta with traditional price‑action patterns lets traders spot reversals that candles alone miss. This guide walks through the mechanics, real‑world examples, and practical tips to improve signal reliability.

Identifying Strong Highs and Lows: A Practical Guide
Distinguish genuine swing extremes from fleeting noise by combining volume spikes, momentum divergences and order‑flow imbalances. This guide walks you through the mechanics, real‑world examples and actionable steps for better trade decisions.

Multi‑Timeframe Structure Mapping: From Daily to 1‑Minute
Translating a daily bullish flag into a 1‑minute entry can tighten risk and boost reward. This article breaks down the mechanics, steps, and common errors of multi‑timeframe structure mapping for active traders.

How to Identify Wyckoff Distribution Phases in US Stocks
Spotting Wyckoff distribution phases lets traders anticipate institutional selling in U.S. equities. This guide breaks down each phase with real‑world charts, actionable steps, and risk‑aware tips.

Wyckoff Accumulation: Springs and Test Entries Explained
The Wyckoff accumulation schematic hinges on springs—sharp false breakouts below support—and the subsequent test entries that confirm demand. This article breaks down the mechanics, shows real‑world charts, and offers actionable tips for disciplined…

Mastering ICT Concepts: A Practical Roadmap for Traders
This guide translates the dense ICT methodology into actionable steps, showing how order blocks, liquidity pools, and fair‑value gaps can be used on real charts to bridge the gap from novice to funded trader.

How Smart Money Targets Equal Highs & Lows (EQH/EQL)
Institutional traders often lock in profit by watching clusters of equal highs or equal lows. This guide explains the mechanics, shows real‑world examples, and offers a practical roadmap for applying the EQH/EQL smart‑money target.

Inversion Fair Value Gaps: Setup, Entry Rules & Strategy
Inversion fair value gaps offer a repeatable edge when traders combine order‑flow delta, volume‑profile voids, and precise stop‑run candles. This guide walks through detection, validation, entry and risk control with real‑world examples.