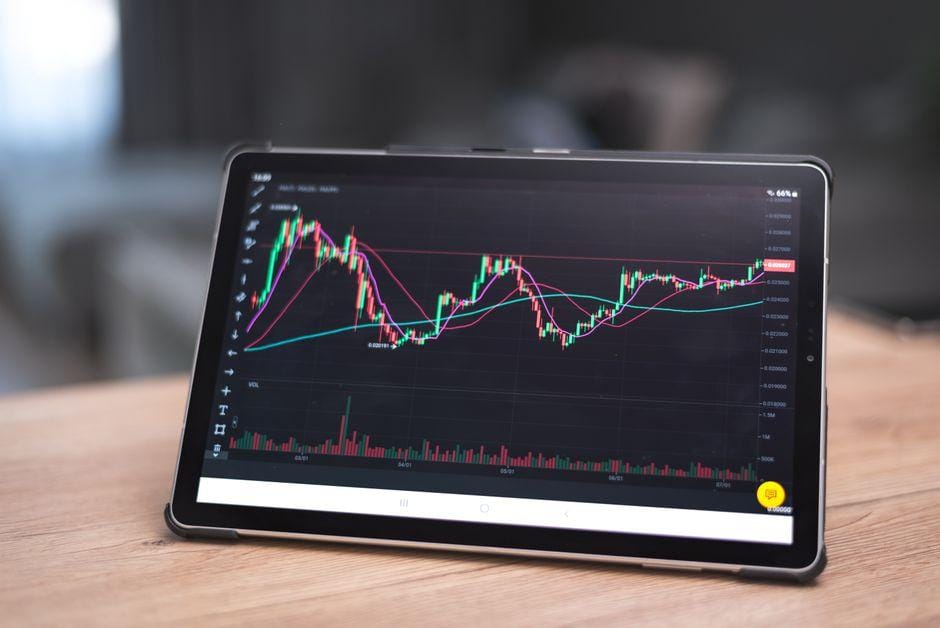
Trading Tools for Modern Investors: 2026 Strategy Guide

Table of Contents
- Introduction
- What Are Modern Trading Tools
- Why a Layered Toolkit Matters for Traders and Investors
- Core Concepts
- Step-by-Step Guide to Building a Modern Trading Stack
- Practical Tips for Better Results
- Common Mistakes to Avoid
- Frequently Asked Questions
- Conclusion
Introduction
Earnings week opens with NVDA gapping on heavy call volume, the VIX printing a fresh intraday high, and the ten-year Treasury yield swinging twenty basis points before lunch. In conditions like these, a single charting window on a laptop struggles to keep pace. The trader who reacts in seconds tends to be the one whose stack has already done the heavy lifting — flagging the unusual options flow, sizing the position against recent realized volatility, and placing the protective stop before the human even confirms the thesis out loud.
Modern markets reward preparation and punish improvisation. Bid-ask spreads widen when liquidity thins, algorithms front-run obvious technical levels, and the SEC’s post-2024 consolidated-tape reforms have quietly reshaped what retail investors can see inside the order book. Building a serious toolkit in 2026 no longer means buying one “best” platform. It means assembling layers — discovery, analysis, execution, and risk — that communicate through APIs and OAuth connections, so each decision travels from idea to filled order without manual rekeying.
This piece walks through the six functional categories of trading tools that a serious retail or prop trader actually uses in 2026. You will see how Level 2 depth-of-market visualization, FIX-protocol execution, multi-factor scanners, Kelly-based sizing, Value-at-Risk dashboards, and read-only broker connections fit together as one system — and where each piece is most likely to fail when the tape gets rough.
What Are Modern Trading Tools
Modern trading tools are the software components a trader leans on to find, analyze, execute, and monitor positions across multiple markets. They range from free charting websites to institutional-grade execution engines, and they cluster into six functional layers: market-data visualization, screening and discovery, order routing and execution, position sizing, risk monitoring, and portfolio integration. Each layer answers a specific question, and the layers only become useful once they start talking to one another through standardized plumbing.
Concrete example. A retail swing trader watching TSLA sets a 9-period exponential moving average on the 15-minute chart inside her charting platform. When price closes below that EMA on rising volume, the platform fires a webhook to a broker’s REST API, which auto-submits a sell order for the trader’s existing long position with a trailing stop anchored at 1.2% of account equity. No human touched the keyboard. The “tool” here is not any single product — it is the chain of four: chart, alert, API, broker.
Why a Layered Toolkit Matters for Traders and Investors
Anyone with a brokerage app can click buy. The reason serious traders invest time in a layered toolkit is that each layer handles a different failure mode. Charting answers “what is the market doing right now?” Screening answers “where is the next opportunity?” Execution answers “how do I get in cheaply?” Sizing answers “how much should I risk on this idea?” Risk monitoring answers “what is my portfolio exposure right now?” Integration answers “can the layers talk to each other without me retyping numbers between them?”
Ignore any one layer and a corresponding risk multiplies. Traders who skip the risk dashboard and run naked delta into a Federal Reserve press conference often discover their portfolio drawdown only when the margin call arrives the next morning. Traders who rely solely on market orders and ignore Level 2 depth-of-market pay hidden spread costs on every entry — costs that compound into a real drag on annual returns. The SEC’s 2024 best-execution proposals have not changed the underlying principle: execution quality is a measurable input, not an afterthought.
Modern trading tools matter because markets are faster, more fragmented, and more conditional than they were a decade ago. A 2026 toolkit replaces manual multi-tasking with mechanical, auditable workflows that survive a bad day. The trader who builds that toolkit deliberately outperforms the trader who downloads five apps and hopes they connect on their own.
Level 2 Order Book and Depth-of-Market Visualization
Level 2 shows the resting limit orders stacked at each price level, plus the market-maker quotes feeding two-sided liquidity. Depth-of-market visualization turns that stack into a horizontal histogram so a trader can see at a glance where a wall of bids or offers is sitting. The mechanism is straightforward: price tends to migrate toward large resting orders because those orders represent supply and demand that must be consumed before price can travel further.
A concrete scenario. An options trader sees a $4 million call sweep on NVDA flagged by an unusual-options-flow scanner the morning of earnings. Before sizing the trade, she pulls up Level 2 on the underlying equity and notices a 250,000-share resting sell order at $905 — roughly 8% of the average daily volume. That wall is a likely cap on any intraday breakout attempt. She passes on the long call, sidesteps a false breakout, and waits for the wall to thin or break before re-evaluating. Without Level 2, she would have only the scanner alert and a vague chart pattern to anchor her decision.
FIX Protocol and Broker API for Algorithmic Execution
FIX — the Financial Information eXchange protocol — is the messaging standard that institutional brokers, exchanges, and liquidity venues have used for decades to route orders across venues. Retail-facing broker APIs, typically REST or WebSocket, sit on top of the same plumbing with friendlier wrappers. The underlying mechanism is identical: your code or platform sends a NewOrderSingle message, the broker routes it, and you receive execution reports back in near real time.
Why this matters in practice. A systematic trader running a mean-reversion strategy on the S&P 500 ETF needs to slice a 10,000-share parent order into child orders timed to the intraday volume curve. Doing that through a manual user interface is impossible. Through a broker API or FIX gateway, the trader sets participation caps, time windows, and price collars, and the system handles the slicing automatically. The same toolkit, in a retail setting, lets a swing trader send a bracket order — entry, stop-loss, and take-profit — as one atomic instruction. That eliminates the dangerous gap where a protective stop is placed seconds too late.
Multi-Factor Market Scanners
A scanner filters a universe of symbols by a defined set of conditions: technical (RSI below 30, MACD bullish cross, 52-week high breakout), fundamental (earnings beat, insider buying, P/E compression), or flow-based (unusual options volume, dark-pool prints, short-interest spikes). The mechanism is essentially a SQL-style query against real-time and historical data, refreshed on a cadence the user defines.
A concrete example. A trader wants to find Nasdaq-listed names with a bullish MACD cross on the daily chart, a relative-volume ratio above 2.0, and a short float under 10%. A single-factor scan would return thousands of noise signals. A multi-factor scan narrows the list to roughly a dozen names that meet all three conditions at once, which the trader can then inspect manually. The principle generalizes: each added filter removes a different kind of false positive, and the combination tends to beat any single filter in isolation.
Step-by-Step Guide to Building a Modern Trading Stack
Step 1 — Map the Six Layers to Your Strategy
Before downloading anything, write down which markets you trade (equities, options, futures, crypto), which timeframes (scalping, day, swing, position), and which failure modes have cost you the most money historically. A scalper needs Level 2 depth and execution speed above all else. A swing trader needs screening and risk dashboards. A position investor needs portfolio analytics and clean broker integration. The stack follows the strategy — never the marketing copy on a vendor’s homepage.
Step 2 — Pick One Tool Per Layer and Prove It on Paper
Choose a charting platform, a scanner, a broker with a documented API, a sizing calculator, and a risk dashboard. Trade the full workflow in a paper or simulated account for at least four weeks. The goal is to find which tool breaks first under your real conditions — bad data, slow API rate limits, OAuth token expirations, dropped websocket connections. A tool that works on a quiet demo can fail at 9:35 a.m. Eastern on a payrolls Friday.
Step 3 — Wire the Layers Together with APIs and OAuth
Once the individual pieces are stable, connect them. Use read-only OAuth between your charting platform and brokerage so alerts can read positions without placing orders. Use webhooks from your scanner to your execution engine. Use the broker’s REST API to submit bracket orders programmatically. Test every connection with a one-share order before you trust it with full size. The wiring is where most retail stacks fail — not the tools themselves.
Practical Tips for Better Results
Size positions by volatility, not by gut. A position-sizing engine that targets a fixed percentage of account equity at risk per trade, scaled by recent realized volatility, prevents the classic error of over-sizing a quiet ticker and under-sizing a volatile one. The math is simple; the discipline is hard.
Measure execution with slippage, not just fill price. Log every fill against the price at signal time. If your average slippage on Nasdaq market orders exceeds a few basis points consistently, you are paying — invisibly — for the absence of a limit-order workflow.
Use read-only OAuth for charting integrations. Granting full trading access to a third-party platform you do not directly control is a security risk that compounds with every new connection. Read-only access still lets you see positions and trigger manual orders.
Backtest scanners, not just strategies. A scanner’s hit rate and false-positive ratio matter as much as the strategy that trades the resulting list. Many “great” strategies underperform because the upstream scanner delivers low-quality candidates.
Keep a manual kill switch. No matter how automated the stack, every system should have a single button that flattens all positions across all brokerages. The fastest way to lose trust in automation is to lose the ability to override it under stress.
Refresh data subscriptions annually. Many free charting tiers throttle intraday data after a few weeks or delay real-time quotes by fifteen minutes. Stale data is a hidden cost on every scan and every entry.
Treat alerts as candidates, not commands. A webhook that auto-executes should be reserved for risk management — stops, position exits — not for entries. Entries deserve a human or a tightly backtested system.
Common Mistakes to Avoid
Buying every tool advertised. Stack bloat creates conflicting signals and slow workflows. One good tool per layer beats three mediocre ones in every category.
Skipping the risk dashboard. A trader who watches only P&L cannot answer “what is my portfolio delta right now?” until after the loss has already happened. Value-at-Risk and expected-shortfall metrics expose the danger before it materializes.
Trusting OAuth without reviewing scopes. Many charting platforms request trade-placement permission by default. Read every scope and tighten it to read-only wherever possible.
Using a single-factor scanner. A scanner that filters on one variable — price only, volume only — generates noise that wastes the trader’s time on manual review. Combine at least two filters, ideally more.
Ignoring latency between layers. A scanner that updates every five minutes paired with an execution API carrying a 200-millisecond round trip creates a workflow where entries are made on stale signals. Measure the lag and design around it.
Confusing free tools with low-cost tools. Free charting often means delayed data and capped indicators. The real cost is the missed opportunity, not the subscription fee.
What are the best trading tools for beginners in 2026?
A beginner needs three layers and nothing more for the first six months: a charting platform with paper trading, a broker with a clean API and a simulator, and a basic position-sizing calculator. Add a scanner and a risk dashboard only after the workflow is stable. Most beginners lose money not from missing tools but from adding too many before the basics become repeatable.
How do modern trading tools work together?
They share data through APIs and OAuth. A scanner pushes candidate tickers to a charting platform, the charting platform triggers an alert on a technical condition, the alert hits a broker’s REST API, and the broker returns an execution report to a risk dashboard. Each step is a small, testable connection. The whole chain is only as strong as its weakest link, so testing each link in isolation matters.
Are paid trading tools worth the subscription cost?
Often yes for active traders, rarely for casual ones. A scanner that reliably filters five thousand symbols down to a dozen high-quality candidates pays for itself within weeks if the trader uses it daily. A charting tier that unlocks real-time Level 2 data pays for itself through tighter spreads on entries. The cost is harder to justify for a trader placing a handful of orders per month.
Which trading tools do professional day traders actually use?
Professional day traders use direct market access through FIX gateways, Level 2 and time-and-sales feeds, co-located servers for latency, and institutional risk dashboards that compute Value-at-Risk and expected shortfall in real time. The retail equivalents — broker APIs, charting platforms with depth-of-market, and risk dashboards — approximate the same workflow with more friction but similar structure.
Can trading tools guarantee profits or beat the market?
No. Trading tools are infrastructure, not edge. A tool can lower transaction costs, surface information faster, and enforce risk discipline, but it cannot replace a profitable strategy. Many backtests that look strong on a tool’s platform fail in live trading because of overfitting, regime change, or execution slippage. Past performance does not guarantee future results.
Is there a reliable free trading tool for stocks and crypto?
Yes, with trade-offs. Most major brokerages offer free charting with delayed data and basic scanners. Free crypto exchanges provide charting but limited API access. The reliability is high; the data freshness and feature depth are not. For a beginner running a small account, the free tier is sufficient. For a trader running meaningful size, the paid tiers usually pay back through tighter execution and richer data.
Conclusion
The single most important lesson is that a modern trading toolkit is a system of connected layers, not a single app. Charting, scanning, execution, sizing, risk, and integration each solve a different problem, and the trader who treats them as one workflow — wired through APIs and OAuth, tested in paper accounts, audited for slippage — operates with a structural edge that manual multi-tasking cannot match.
The practical next step is to pick one tool per layer, run the full workflow in simulation for a month, and measure the slippage and false-positive rate at each step. Replace the weakest link before adding a new layer. That is how a 2026 toolkit gets built without wasting money on shelfware.
Risk disclaimer. All trading involves the risk of loss. The mechanisms and tools described here do not guarantee profits and cannot eliminate the possibility of substantial drawdowns. Market conditions change quickly, and past performance does not guarantee future results. Test every component in a paper or simulated account before risking real capital, and never deploy capital that you cannot afford to lose.
—
This article is for educational purposes only and does not constitute investment advice. Trading and investing carry risk of loss; never invest more than you can afford to lose.
Last reviewed: August 2026.