Market Analysis: How to Turn Analysis into Action

Table of Contents
- Introduction
- What Is Market Analysis?
- Why Market Analysis Matters for Traders and Investors
- Core Concepts
- Step-by-Step Guide
- Practical Tips for Better Results
- Common Mistakes to Avoid
- Frequently Asked Questions
- Conclusion
Introduction
Consider a trader who spends six hours dissecting the Federal Reserve’s latest dot plot, analyzing the steepness of the yield curve, and identifying a textbook bullish flag on a daily chart. Every data point suggests a high-probability long entry. Yet, as the price hits the trigger point, the trader freezes. They begin to question if the inflation data is already priced in or if a sudden liquidity sweep will hunt their stop loss. By the time they finally execute the buy order, the move is halfway complete, and they have entered at the top of the range.
This is the phenomenon of analysis paralysis. The gap between identifying a pattern and executing a trade is where the majority of retail accounts are depleted. Many market participants possess the intellectual capacity to perform high-level market analysis, but they lack the mechanical framework required to convert that data into a live position. They treat analysis as a predictive crystal ball rather than a risk-management tool.
In a market environment characterized by high implied volatility and rapid regime shifts, the ability to act decisively is a primary competitive advantage. This guide outlines how to move from theoretical interpretation to disciplined execution. You will learn how to synthesize disparate analysis styles into a single, actionable trigger that removes emotion from the equation.
What Is Market Analysis?
Market analysis is the systematic process of evaluating financial data to determine the probability of a future price movement. It is fundamentally not about predicting the future with absolute certainty, but about identifying an edge. An edge is a specific set of conditions where the probability of one outcome is higher than the alternative, allowing a trader to maintain a positive expectancy over a large sample of trades.
For instance, a trader might observe a stock trading at a multi-year historical support level while the company reports quarterly earnings that beat consensus analyst expectations. The analysis does not guarantee that the price will rise. Instead, it suggests that the risk of further downside is mathematically limited compared to the potential for an upward correction. By quantifying this asymmetry, the trader transforms a guess into a calculated risk.
Why Market Analysis Matters for Traders and Investors
Without a structured approach to market analysis, trading is effectively gambling. Professional institutional participants use analysis to define their edge and, more critically, to determine the exact point at which their thesis is proven wrong. If you enter a position without an analytical basis, you possess no objective criteria for when to exit, leaving you vulnerable to the whims of market volatility.
For day traders, rigorous analysis allows them to identify intraday liquidity pockets and volatility spikes that offer quick profit opportunities. For long-term investors, it serves as a safeguard against buying into a speculative bubble by comparing current valuations to historical norms and mean averages. Ignoring this process leads to emotional trading, where decisions are driven by FOMO (fear of missing out) or the dangerous hope that a losing position will magically recover.
The primary benefit of a rigorous process is the removal of discretion. When analysis is converted into a set of mechanical rules, the trader stops asking if they feel the market will go up and starts asking if the current setup meets their predefined criteria. This shift from subjective feeling to objective verification is what separates professional capital managers from retail speculators.
Fundamental Analysis: Macroeconomic Indicators and Earnings Reports
Fundamental analysis focuses on the intrinsic value of an asset. It examines the underlying drivers—economic data, corporate health, and geopolitical events—that move prices over the medium to long term. In equity markets, this involves a deep dive into balance sheets, free cash flow statements, and P/E ratios to determine if a stock is undervalued or overvalued relative to its peers. In the forex markets, fundamental analysis means tracking central bank policies from the Federal Reserve or the European Central Bank (ECB), specifically focusing on interest rate differentials and quantitative easing or tightening.
Consider a scenario where a tech company reports a positive earnings surprise and raises its forward guidance. A fundamental analyst sees this as a catalyst for a higher valuation. However, the actual trade occurs when this fundamental catalyst aligns with a price trigger. For example, combining a breakout above a 200-day moving average with that positive earnings surprise provides a high-conviction signal to enter a long position. In this framework, the fundamental news provides the why, and the technical moving average provides the when.
Technical Analysis: Candlestick Patterns and Support/Resistance Levels
Technical analysis ignores the intrinsic why and focuses entirely on the what. It operates on the premise that all known information is already reflected in the price. By studying price action, volume, and mathematical indicators, traders identify patterns that repeat over time due to human psychology. Support and resistance levels act as psychological barriers where buying or selling pressure typically intensifies, often leading to price reversals or breakouts.
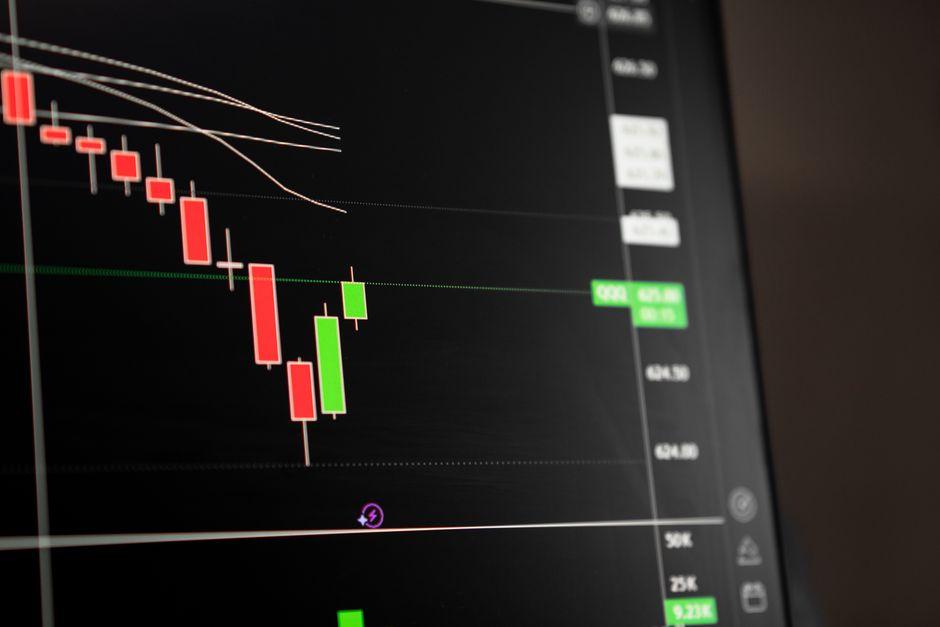
A practical application involves a trader identifying a double bottom pattern on a 4-hour chart of an ETF. The price has tested a specific floor twice and failed to break lower, indicating strong demand at that level. If the trader then spots a bullish engulfing candlestick pattern at this support, the analysis suggests a high probability of reversal. The action is to place a buy order with a stop loss positioned just below the support floor. Here, the technical analysis defines the risk-reward ratio; the distance to the stop represents the risk, while the distance to the next major resistance level represents the potential reward.
Sentiment Analysis: Put/Call Ratios and Fear & Greed Index
Sentiment analysis measures the psychological state of market participants. Markets often move in extremes: excessive optimism leads to unsustainable bubbles, and excessive pessimism often marks the absolute bottom. Tools such as the Put/Call ratio, which compares bearish bets to bullish ones, or the VIX (the CBOE Volatility Index), provide a window into the collective mood of the street.
Imagine a period where inflation data is coming in higher than expected, triggering a general market sell-off. While the primary trend is bearish, the Fear & Greed Index hits Extreme Fear, and the Put/Call ratio reaches a historical peak. This suggests the market is over-extended to the downside and may be primed for a bounce. A sophisticated trader might identify a bearish divergence in the RSI (Relative Strength Index)—where price makes a new low but the indicator does not—and use this sentiment extreme to hedge their portfolio with put options or look for a mean-reversion long trade.
Step 1 — Define Your Market Regime
Before looking at a single chart, you must identify the current market regime. Is the market trending up, trending down, or is it ranging sideways? Using the wrong tool for the wrong regime is a primary cause of significant drawdowns. Trend-following strategies typically fail in ranges, and mean-reversion strategies are often crushed during strong, parabolic trends.
Begin by looking at the higher timeframe, such as the weekly or daily chart. If the price is consistently making higher highs and higher lows, you are in an uptrend. If the price is bouncing between two clear horizontal boundaries without making progress in either direction, you are in a range. Your decision here dictates your entire strategy: in a trend, you buy the dips; in a range, you sell the tops and buy the bottoms.
Step 2 — Synthesize the Analysis (The Confluence Filter)
Avoid the mistake of relying on a single indicator. Professional execution requires confluence—a state where multiple independent forms of analysis point to the same conclusion. Create a strict checklist of requirements that must be met before a trade is even considered.
For example, a Long Setup checklist might look like this:
1. Fundamental: The asset is in a sector with positive macroeconomic tailwinds and strong earnings growth.
2. Technical: Price is sitting on a major daily support level or a key Fibonacci retracement level.
3. Sentiment: The VIX is stabilizing after a spike, suggesting that panic is subsiding and buyers are stepping back in.
4. Trigger: A 15-minute candle closes above the previous day’s high with an increase in volume.
If only two of these four criteria are met, the trade is discarded. This mechanical filter removes the temptation to force a trade based on a single, weak signal or a gut feeling.
Step 3 — Calculate Position Sizing and Risk
Analysis is useless if one bad trade wipes out your account. Before executing, you must determine exactly how much capital to risk. This is achieved by calculating the distance between your entry price and your stop loss, then deciding what percentage of your total equity that distance represents.
If you have a $10,000 account and risk 1% per trade, your maximum loss is $100. If your stop loss is $2 away from your entry price, you can buy 50 shares. This mechanical calculation ensures that no single mistake results in a catastrophic loss. The decision is no longer about how much money you might make, but how much you are willing to lose if the analysis is wrong. This is the essence of professional risk management.
Step 4 — Execute and Set the Exit Plan
The final step is the physical act of entering the market. To avoid the hesitation mentioned earlier, use limit orders or stop-market orders. Do not market buy into a volatile move, as slippage can instantly degrade your risk-reward ratio. Simultaneously, set your take-profit and stop-loss orders.
The exit plan must be as rigorous as the entry. Decide whether you will exit at a fixed risk-reward ratio (such as 1:3), at a specific technical level (the next major resistance zone), or via a trailing stop to capture a larger trend. Once the trade is live, the analysis phase ends and the management phase begins. Changing your exit criteria while a trade is open is a common mistake that leads to emotional decision-making.
Practical Tips for Better Results
- Maintain a detailed trading journal to record the analysis behind every trade. Reviewing these entries after a month reveals whether your edge is actually working or if you have simply been lucky during a bullish market cycle.
- Focus on liquidity. Price tends to move toward areas of high liquidity where many orders are resting. Identifying these liquidity pools can help you refine your entry and exit points to avoid getting caught in low-volume chops.
- Align your timeframe with your specific goals. If you are a swing trader, ignore the 5-minute noise. If you are a scalper, the daily chart is only for general direction; the 1-minute chart is where the execution happens.
- Respect the spread. In low-liquidity assets, the gap between the bid and ask price can eat a significant portion of your profit, especially in short-term trading. Always factor the spread into your risk-reward calculations.
- Monitor correlations. If you are long on three different tech stocks, you are not diversified; you have one large, concentrated position in the tech sector. Ensure your trades are not all betting on the same macroeconomic outcome, such as a drop in Treasury yields.
- Avoid indicator soup. Using ten different oscillators on one chart creates conflicting signals and leads back to analysis paralysis. Pick one indicator for trend, one for momentum, and one for volatility.
Common Mistakes to Avoid
- Revenge Trading: Attempting to win back a loss by increasing position size. This ignores the analysis and replaces it with raw emotion, which almost always leads to a deeper drawdown.
- Over-Optimization: Tweaking a technical indicator until it perfectly fits past data. This is known as overfitting and almost always fails in live markets because the future rarely mirrors the past with exact precision.
- Ignoring the Stop Loss: Moving a stop loss further away as price approaches it. This turns a calculated risk into an open-ended gamble and is the fastest way to blow an account.
- Confirmation Bias: Seeking out news and charts that support your existing bias while ignoring data that contradicts it. This leads to holding a losing position long after the thesis has been invalidated.
- Trading the News Directly: Entering a trade the second a headline hits the tape. Institutional algorithms react in milliseconds; retail traders who chase the initial spike often enter at the peak of the move, just as the pros are taking profits.
How do I start market analysis for beginners?
Start by picking one asset and observing its price action over a few months. Learn to identify the primary trend and basic support and resistance levels. Once you can identify these, add one fundamental driver, such as interest rate changes, and one technical indicator, like a 50-day moving average, to see how they interact. The goal is to build a mental library of how price reacts to specific catalysts.
What is the difference between fundamental and technical analysis?
Fundamental analysis looks at the intrinsic value of an asset based on economic data and financial statements to determine what the price should be. Technical analysis looks at price and volume to determine when the price is likely to move. One focuses on the cause (the value), while the other focuses on the effect (the price action).
Why is market analysis important for day trading?
Day trading happens in a high-noise environment where price can swing wildly based on a single tweet or a minor data release. Analysis provides the boundaries, such as support and resistance, and the triggers, such as candlestick patterns, that prevent a trader from guessing. It allows them to identify high-probability windows of volatility where profits are most likely to be realized.
When should I trust technical analysis over fundamentals?
In the short term, spanning minutes to days, technical analysis is often more reliable because price action reflects the immediate psychology of buyers and sellers. Over the long term, spanning months to years, fundamentals typically drive the price. If you are scalping, trust the chart; if you are investing for a decade, trust the balance sheet.
Can market analysis predict price movements with 100% accuracy?
No. Market analysis is about probabilities, not certainties. Even the most perfect setup can fail due to an unexpected geopolitical event, a sudden liquidity crisis, or a “black swan” event. The goal is to have a positive expectancy over a large sample of trades, not a perfect win rate.
Is market analysis necessary for long-term investing?
Yes, but the focus shifts. A long-term investor uses analysis to ensure they are not overpaying for an asset and to verify that the company’s competitive advantage remains intact. It helps them decide when to rebalance a portfolio or exit a position that no longer meets its original investment thesis.
Conclusion
The transition from a student of the markets to a profitable trader happens when you stop treating analysis as a way to be right and start treating it as a way to manage risk. The most successful participants in the S&P 500 or the forex markets are not those who predict every move, but those who have a mechanical process for entering and exiting positions.
Your next step is to build a hard-rule checklist. Define exactly what fundamental, technical, and sentiment conditions must be met before you risk a single dollar. By removing the need for a gut feeling at the moment of execution, you eliminate the hesitation that leads to poor entries and missed opportunities.
Trading involves significant risk of loss. No amount of analysis can eliminate the possibility that a trade will result in a loss. Always use stop losses, never risk more than you can afford to lose, and prioritize the preservation of your capital over the pursuit of aggressive gains.
*
Disclaimer: Trading and investing involve substantial risk of loss. The information provided in this article is for educational purposes only and does not constitute financial advice. Past performance is not indicative of future results.
—
This article is for educational purposes only and does not constitute investment advice. Trading and investing carry risk of loss; never invest more than you can afford to lose.
Last reviewed: August 2026