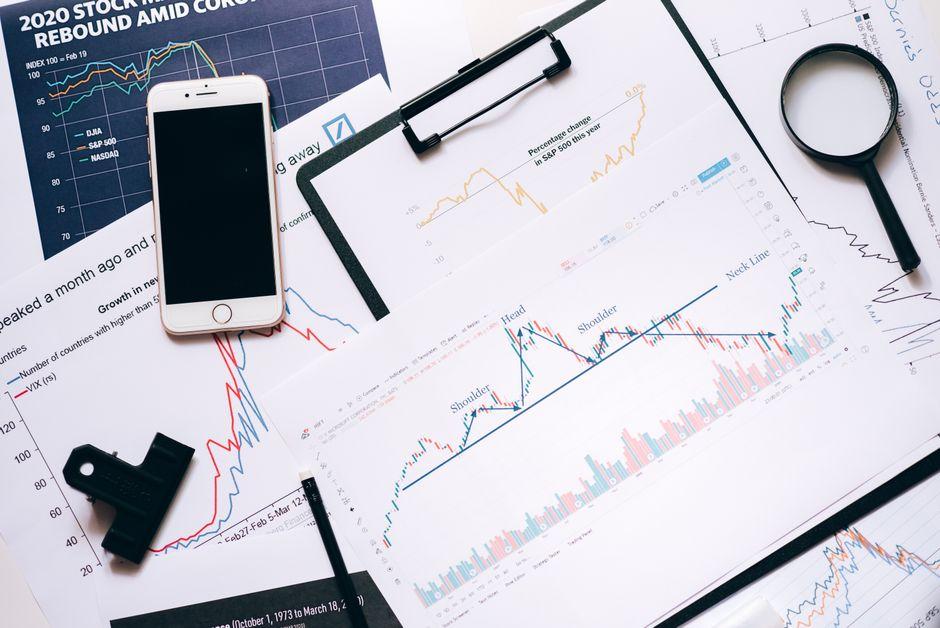
Best Trendlines Strategies for Crypto Markets Explained

Table of Contents
- Introduction
- What Is Trendline Trading in Crypto
- Why Trendlines Matter for Crypto Traders
- Core Concepts
- Step-by-Step Guide
- Practical Tips for Better Results
- Common Mistakes to Avoid
- Frequently Asked Questions
- Conclusion
Introduction
Crypto markets move fast. A support level that held yesterday can break overnight after a whale moves a large position or regulatory news hits the wires. For traders, finding structure in this noise is essential — and trendlines remain one of the most universally applicable tools for doing exactly that.
The challenge is that crypto markets exhibit volatility far beyond what you see in traditional equities. A trendline that works perfectly on a stock chart often fails in crypto because price action whipsaws through key levels. Yet the traders who consistently profit in this space have learned to adapt classic trendline techniques to account for that volatility.
This guide covers the best trendline strategies specifically tailored for crypto markets. You’ll learn how to draw accurate trendlines, confirm breakouts with volume, align multiple timeframes for stronger signals, and manage risk when these setups fail. Every concept includes a real trading scenario so you can apply what you learn immediately.
What Is Trendline Trading in Crypto
Trendline trading is a technical analysis method that uses straight lines drawn on a price chart to identify and trade with the prevailing market direction. In crypto, traders draw these lines by connecting swing highs (for downtrends) or swing lows (for uptrends) and use them as dynamic support or resistance zones.
A rising trendline connects a series of higher lows, acting as a floor that price bounces off during an uptrend. A falling trendline connects lower highs, acting as a ceiling in a downtrend. When price breaks through these lines, it often signals a shift in market structure — and that’s where the trading opportunity emerges.
Consider Bitcoin on a daily chart during a recovery phase. If price finds support at $65,000, then pulls back to $62,000 before rallying again to $68,000, you can draw a line connecting those two lows. That line becomes your reference point for future pullbacks. If price drops to touch that trendline again around $64,500 and bounces, you have a potential long entry with a clear risk level below the line.
Why Trendlines Matter for Crypto Traders
Crypto traders face a unique problem: extreme volatility combined with 24-hour markets. Assets like Bitcoin and Ethereum can move 5% in hours, and altcoins can move 20% or more in a single session. Without a framework for identifying valid entry and exit points, traders either overtrade or sit on the sidelines entirely.
Trendlines solve this problem by providing objective, visual reference points for decision-making. They work across any timeframe — from the 15-minute chart for scalpers to the weekly chart for position traders. They also adapt well to crypto-specific patterns like the steep corrective rallies that follow major Bitcoin drawdowns.
That said, trendlines in crypto require stricter confirmation than in traditional markets. A breakout that would signal a trade in equities often turns out to be a false signal in crypto due to the prevalence of stop-hunting and liquidity grabs. The strategies in this guide account for those differences.
Trendline Breakout Confirmation with Volume
A trendline breakout means little without confirmation. In crypto, the key is combining price action with volume. When price breaks above a falling trendline, look for a volume spike — ideally 1.5x or more the average volume for that market. Without elevated volume, the breakout is more likely to be a fakeout.
For example, imagine Ethereum on a daily chart forming a descending trendline connecting several lower highs during a correction. Price approaches the trendline at $2,850 and breaks above it on increased volume. This confirms that buyers are stepping in with real conviction. You would enter a long position above the breakout candle, with a stop-loss placed just below the trendline — typically 1-2% below for crypto’s volatility.
Volume confirmation filters out the majority of false breakouts. Markets can push through a trendline on thin volume, but sustained moves require participation from real buyers and sellers.
Multiple Timeframe Trendline Alignment
The strongest trendline signals appear when the same trendline level appears on multiple timeframes. This is known as confluence. If the 4-hour chart shows a rising trendline at $3,000 and the daily chart shows the same level as a key support, your conviction increases significantly.
Traders typically use a three-step process: identify the trend on the higher timeframe (daily or weekly), confirm it on the intermediate timeframe (4-hour), and execute on the lower timeframe (15-minute or 1-hour). This ensures you’re trading with the larger market direction rather than fighting it.
For example, if Bitcoin shows a clear uptrend on the weekly chart and you identify a rising trendline on the daily chart, any breakout on the 4-hour chart becomes a higher-probability trade. You’re not just trading a trendline — you’re trading a trendline that aligns with the broader market structure.
Dynamic Support-to-Resistance Flip
One of the most powerful concepts in trendline trading is the flip — when a broken support becomes resistance, or vice versa. In crypto, this flip often happens faster and more violently than in traditional markets because of the lower liquidity and higher leverage common in the space.
Draw a rising trendline during an uptrend. When price eventually breaks below it, that line often becomes resistance. If price rallies back to test the old trendline and gets rejected, you have a high-probability short opportunity. The beauty of this setup is that it comes with a clear stop-loss above the trendline, making risk management straightforward.
Suppose Solana has been trending up, finding support along a rising trendline near $145. Eventually price breaks below that line on heavy selling. A few days later, price attempts to reclaim the $145 level but gets rejected. You can enter a short at $144 with a stop above $147 — a tight, well-defined risk profile.
Channel Trendline Parallel Trading
Channels combine two parallel trendlines — one for support and one for resistance — to define a trading range within a trend. In crypto, ascending channels are particularly useful for capturing moves in trending markets without guessing the top.
To draw a channel, first identify the main trendline connecting the higher lows. Then draw a parallel line touching the first significant high. Price will typically bounce between these two lines, giving you clear buy zones (near the support trendline) and take-profit zones (near the resistance trendline).
A practical example: a Solana ascending channel between $145 support and $175 resistance. You would buy near $145 and take profit near $175, then watch for the next channel bounce. If price breaks above the channel, it often signals an acceleration — and you can chase the breakout while placing a stop just below the channel’s upper boundary.
Trendline Slope Angle for Momentum Measurement
The angle of a trendline reveals information about momentum. A steep trendline indicates strong, possibly unsustainable momentum. A shallow trendline suggests a weak trend that could reverse at any time. This matters because the steeper the trendline, the more likely it is to break dramatically when exhaustion sets in.
In practice, you can use the slope angle to adjust your risk parameters. If you’re trading an extremely steep rising trendline in an altcoin, place your stop-loss closer to the line than you would for a gradual slope. The faster price is rising, the faster it can reverse.
For a concrete scenario: Bitcoin forms a shallow rising trendline over several months, climbing from $55,000 to $60,000. Meanwhile, a newer altcoin forms a steep rising trendline in weeks, doubling in price. The Bitcoin trendline is more durable; the altcoin trendline is more likely to snap. Adjust your position sizing accordingly — smaller positions on steep trends, larger on gradual ones.
Trendline Touch-Point Validation
A trendline gains validity with each successful touch. A trendline with three or more touches is more reliable than one with just two touches. This is known as the three-touch rule, and it applies across all markets — including crypto.
When you draw a trendline that has been tested multiple times without breaking, it becomes a stronger reference point. A break of a three-touch trendline often signals a significant trend change rather than a brief deviation.
Imagine you draw a descending trendline on Ethereum’s 4-hour chart that has been touched four times over two weeks. Each time price approaches the line, it reverses lower. On the fifth approach, price finally breaks above with momentum. This breakout carries more weight than a break of a trendline that was only touched twice.
Step-by-Step Guide
Step 1: Identify the Market Trend First
Before drawing any trendline, determine the broader trend on your chosen timeframe. On a daily chart, look at the last 30-60 days of price action. If you see a series of higher highs and higher lows, you’re in an uptrend. Lower highs and lower lows indicate a downtrend. Consolidation without a clear direction means you should wait.
This step matters because trendlines only work when you’re trading with the trend. Drawing a falling trendline in an uptrend, or vice versa, creates confusion and poor trade selection. Get the direction right first.
Step 2: Draw the Trendline Using Swing Points
Connect the most obvious swing lows for an uptrend or swing highs for a downtrend. Use the wicks of the candles rather than the close prices when possible, because crypto markets frequently test support and resistance through wicks before rejecting.
Once drawn, extend the line into the future. It should not be forced to touch every price action — it’s a guide, not a perfect fit. A clean line connecting three or more significant pivots is more valuable than a line that hugs every minor swing.
Step 3: Confirm the Setup Before Entering
Wait for price to approach the trendline and react. A touch alone is not a signal. Look for either a bounce (for trend-following entries) or a confirmed breakout (for reversal entries). Confirm with volume, and check the same level on higher timeframes for confluence.
When entering, place your stop-loss on the opposite side of the trendline. For a long trade, this means below the rising trendline. For a short, above the falling trendline. The distance should be enough to account for crypto’s wicks but tight enough that a break invalidates your thesis cleanly.
Practical Tips for Better Results
- Use the daily chart as your primary timeframe for trendline identification, then filter entries on the 4-hour or 1-hour charts for better timing.
- Always check volume before entering a trendline trade. A breakout on below-average volume is a warning sign, not a confirmation.
- Redraw trendlines as new data comes in. Markets evolve, and an old trendline that no longer reflects current price action becomes noise.
- Combine trendlines with horizontal support and resistance levels for stronger confluence zones. When both align, the signal is more reliable.
- Set price alerts near trendlines rather than staring at charts. Crypto markets operate 24/7, and you will miss opportunities if you watch every candle.
- Adjust your position size based on the proximity of your stop-loss. Tighter stops allow for larger positions; wider stops require smaller ones.
- Practice drawing trendlines on historical charts before risking real capital. This builds pattern recognition without financial risk.
Common Mistakes to Avoid
- Drawing trendlines that are too steep, which creates false confidence in unsustainable momentum and leads to large drawdowns when price reverses.
- Entering trades on trendline touches alone, without waiting for confirmation through price action or volume.
- Ignoring higher timeframe trends and taking trades that fight the broader market direction, which reduces win rates significantly.
- Placing stop-losses too close to the trendline in volatile crypto markets, where wicks frequently sweep liquidity before price reverses.
- Overcomplicating charts with too many trendlines, which creates decision paralysis and contradictory signals.
- Failing to adjust for crypto’s 24/7 nature, where trendlines can break overnight while you’re not watching, leading to gap moves that invalidate stops.
Frequently Asked Questions
How do you draw accurate trendlines in crypto trading?
Connect the most significant swing lows for uptrends and swing highs for downtrends. Use candle wicks rather than close prices when possible, as crypto often tests levels through wicks. Aim for at least three touches to validate the trendline. Adjust your chart zoom level so you can see 30-60 days of price action clearly.
What is the best timeframe for trendline trading in crypto?
The daily chart works best for identifying the primary trend and drawing the most reliable trendlines. Use the 4-hour or 1-hour chart to time entries and exits. Avoid timeframes below 15 minutes for trendline analysis because noise dominates and false breakouts increase significantly.
Why do trendlines fail in highly volatile crypto markets?
Crypto markets experience rapid price swings, frequent liquidity grabs, and 24-hour trading that doesn’t pause for “overnight gaps.” Trendlines fail when traders fail to confirm breakouts with volume or when they draw trendlines on timeframes too short to capture meaningful market structure. The solution is stricter confirmation and higher-timeframe analysis.
When should I enter a trade after a trendline breakout?
Wait for a retest of the broken trendline before entering. If price breaks above a descending trendline and then pulls back to test it as support, that retest provides a higher-probability entry than chasing the initial breakout. Enter on the retest with a stop below the trendline.
Can trendlines predict Bitcoin and Ethereum price movements?
Trendlines identify potential support and resistance zones but cannot predict exact prices. They work as probability tools: when price approaches a well-established trendline, the chance of a reaction increases, but outcomes depend on broader market conditions, volume, and momentum at the time.
Is trendline trading profitable for beginners in crypto?
Trendlines are one of the more beginner-friendly technical tools because they are visual and intuitive. But beginners must learn to wait for confirmation, use appropriate stop-losses, and combine trendlines with other analysis methods. Profitability comes from discipline, not from any single tool.
Conclusion
Trendlines remain one of the most effective tools for finding structure in crypto’s chaos. The key is applying them with stricter confirmation than you would in traditional markets — volume validation, multiple timeframe alignment, and patient waits for retests rather than chasing breakouts immediately.
Start by drawing clean trendlines on the daily chart using swing points, confirm your setups with volume and higher-timeframe alignment, and always define your risk before entering. The best trendline strategies in crypto aren’t the most complex — they’re the ones executed with discipline.
Remember: no technical tool guarantees profits. Crypto markets are among the most volatile on the planet, and trendlines will fail as often as they succeed. Protect your capital with proper position sizing, never risk more than you can afford to lose on a single trade, and treat every setup as a probability — not a certainty.
—
This article is for educational purposes only and does not constitute investment advice. Trading and investing carry risk of loss; never invest more than you can afford to lose.
Last reviewed: August 2026