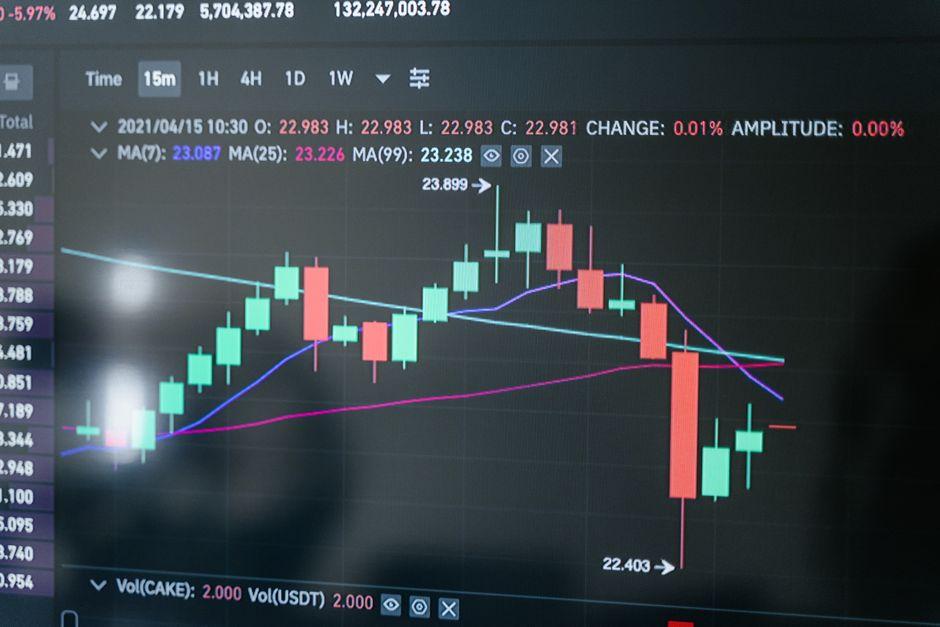
How to Use Solana on TradingView: Complete Guide

Table of Contents
- Introduction
- What Is TradingView and Why Use It for Solana
- Why Solana Analysis Matters for Traders and Investors
- Core Concepts for Solana Trading on TradingView
- Step-by-Step Guide to Setting Up Your Solana Chart
- Practical Tips for Better Solana Analysis
- Common Mistakes to Avoid
- Frequently Asked Questions
- Conclusion
Introduction
How to use Solana TradingView sits at the center of this guide, and understanding it changes how traders approach the market.
Solana has established itself as one of the leading layer-1 blockchains, with its native token SOL ranking among the most traded cryptocurrencies globally. If you’re looking to analyze price action, identify trade setups, and monitor key levels for Solana, TradingView remains the industry standard for technical charting. Whether you’re a day trader reacting to 15-minute moves or a swing trader watching weekly trends, understanding how to use Solana on TradingView gives you a significant edge.
This guide walks you through everything from locating Solana on the platform to configuring indicators, setting price alerts, and applying chart settings tailored for crypto markets. You’ll find concrete examples using real chart configurations you can implement immediately.
What Is TradingView and Why Use It for Solana
TradingView is a web-based charting platform that provides real-time and delayed price data across global markets, including cryptocurrency exchanges. It offers a comprehensive suite of drawing tools, over 100 built-in indicators, and an active community that shares chart ideas and strategies. For Solana specifically, TradingView aggregates data from major exchanges like Binance, Coinbase, and Kraken, giving you a consolidated view of SOL price action.
The platform operates entirely in your browser without requiring software installation. You can access it from any device with an internet connection, which makes it particularly useful for traders who need to monitor positions across multiple screens or check charts on the go.
One of TradingView’s strongest features for crypto traders is its Pine Script capability, which allows you to create custom indicators or modify existing ones. The free tier provides ample functionality for most retail traders, though a premium subscription unlocks additional chart layouts, alerts, and technical analysis features.
Why Solana Analysis Matters for Traders and Investors
Solana’s price volatility exceeds that of many other cryptocurrencies, presenting both opportunity and risk. The token frequently experiences double-digit percentage moves within single trading sessions, driven by factors ranging from network activity metrics to broader crypto market sentiment. Without proper charting tools, attempting to time entries and exits becomes speculation rather than analysis.
TradingView enables you to identify structural elements that experienced traders rely on: support and resistance zones, trend direction, momentum shifts, and volatility expansions. These aren’t guesswork—they represent where market participants historically place orders, and price tends to react when it revisits these levels.
For example, if Solana has been consolidating around $120 on the SOL/USDT pair, drawing a horizontal line at that level and monitoring how price behaves when it returns gives you a probabilistic edge. You can then decide whether to enter a position, scale out, or set protective stops based on what the chart reveals about market structure.
Beyond individual trades, consistent chart analysis helps you develop and refine a trading plan. Recording your observations—whether on TradingView itself through notes or in a separate journal—builds a track record that reveals what strategies work for your risk tolerance and time availability.
SOL/USDT Trading Pair Dynamics
The primary trading pair for Solana on most exchanges is SOL/USDT, which quotes Solana’s price in Tether (a USD-stablecoin). Understanding this pair’s dynamics matters because USDT trading pairs isolate crypto-specific movements from fiat currency fluctuations. When you analyze SOL/USDT, you’re viewing pure Solana market sentiment rather than USD strength fluctuations.
On TradingView, you can access SOL/USDT by typing the ticker in the search bar. The platform pulls data from your selected exchange, though you can switch between exchanges to compare price sources. For most traders, the default Binance or Coinbase data provides sufficient liquidity and accuracy.
When analyzing this pair, pay attention to the bid-ask spread displayed in the instrument info panel. During volatile periods, spreads widen, meaning you’ll pay more to enter and receive less when exiting. This implicit cost eats into profits, particularly for short-term traders.
Moving Averages and RSI for Crypto
Moving averages smooth price data to reveal trend direction. The 50-period and 200-period simple moving averages (SMA) are widely watched on daily and weekly charts. When the 50 SMA crosses above the 200 SMA, traders call this a “golden cross”—historically a bullish signal. The reverse, a “death cross,” suggests bearish momentum.
For shorter timeframes, many traders apply the 9-period and 21-period exponential moving averages (EMA). These respond faster to recent price changes, making them suitable for intraday strategies.
The Relative Strength Index (RSI) measures momentum on a 0-100 scale. Readings above 70 indicate overbought conditions—price may be due for a pullback. Readings below 30 suggest oversold conditions. But strong trends can sustain overbought or oversold readings for extended periods, so never use RSI in isolation.
Here’s a practical setup: On a 4-hour SOL/USDT chart, add the 50-period SMA and RSI(14). When price approaches the 50 SMA from below and RSI crosses above 30 from oversold territory, you have a confluence of trend-following and momentum signals. This type of confirmation improves probability, though it remains a probability—not a certainty.
Volume Profile and Market Structure
Volume profile displays trading activity at specific price levels over a selected timeframe, revealing where the most trading occurred. These high-volume nodes (HVNs) often act as support or resistance because many participants traded there, creating “fair value” zones. Low-volume nodes (LVNs) represent areas where price moved quickly—these frequently break during trend changes.
On TradingView, you can activate Volume Profile through the indicator panel. Select “Volume Profile” and choose a range based on your trading timeframe. For swing trades, a rolling 20-day profile works well. For intraday analysis, a session-based profile shows today’s trading distribution.
Understanding market structure means identifying swing highs and lows—the pivots that define whether an asset is trending or ranging. In an uptrend, each successive high and low sits above the previous one. When that structure breaks (price falls below the prior low in an uptrend), traders watch for trend reversal signals.
Bollinger Bands for Volatility Trading
Bollinger Bands consist of a middle band (typically a 20-period SMA) with upper and lower bands set two standard deviations away. When bands contract—called “squeeze”—volatility is compressing and traders anticipate a breakout. When bands expand, volatility is elevated and trending action may follow.
For Solana, Bollinger Bands prove particularly useful during the coin’s characteristic volatility expansions. On a 15-minute chart, when price breaks above the upper band with strong volume, momentum traders often enter long positions. A common approach places the stop-loss at the middle band, giving price room to fluctuate while limiting downside if the breakout fails.
Conversely, when price touches the lower band in a downtrend, some traders look for short setups, anticipating mean reversion toward the middle band. This works until it doesn’t—trends can extend far beyond Bollinger Bands, so always manage position size appropriately.
Price Alert Configuration
Price alerts notify you when Solana reaches your target price, eliminating the need to constantly watch the chart. TradingView offers alerts through browser notifications, email, or push notifications to your phone via the TradingView mobile app.
To set an alert, right-click on your chart at the desired price level and select “Add Alert at [price]” or use the Alert panel (clock icon in the top toolbar). You can configure alerts for price crossing above or below a level, or for percentage changes over a specified period.
For example, create an alert at $150 to notify you when Solana approaches key resistance after consolidating. This lets you prepare your trade plan—reviewing the chart, checking order book depth, and executing with discipline rather than reacting impulsively in the moment.
Alerts work even when the chart is closed, making them essential for anyone who cannot monitor screens continuously. Just remember that alerts trigger based on the data source you’ve selected, so ensure you’re using an exchange with sufficient liquidity for your needs.
Step 1: Locate Solana on TradingView
Navigate to TradingView and sign in (creating a free account preserves your chart layouts and alerts). In the top-left search bar, type “SOL/USDT” or “Solana.” Select the appropriate pair from the dropdown—TradingView offers multiple data sources, so choose one with sufficient volume for your trading style.
Once selected, the default chart displays candlestick data. You can switch between timeframes using the toolbar above the chart: 1 minute, 5 minutes, 15 minutes, 1 hour, 4 hours, daily, weekly, and monthly. Your choice should align with your trading timeframe—scalpers use minute charts while swing traders gravitate toward daily and weekly views.
Step 2: Configure Your Indicators
Click “Indicators” in the top toolbar (or press “/” on your keyboard). Search for and add the following in sequence:
– Simple Moving Average (SMA): Set length to 50
– Simple Moving Average (SMA): Set length to 200
– Relative Strength Index (RSI): Set length to 14 (leave other parameters default)
– Bollinger Bands: Set length to 20 and stdDev to 2
After adding indicators, you can customize colors and line styles by clicking the gear icon next to each indicator name in the data window. Many traders prefer contrasting colors—green for the 50 SMA, red for the 200 SMA, and distinct colors for RSI and Bollinger Bands.
Step 3: Draw Key Levels and Set Alerts
Use the horizontal line tool (keyboard shortcut: Alt+H) to draw support and resistance at significant price levels. For Solana, focus on round numbers ($100, $120, $150) and prior swing highs and lows. Label each line by double-clicking and adding text.
To set a price alert, right-click at your target price point, select “Add Alert at [price],” and configure your notification preferences. Test that alerts work by setting a dummy alert at the current price—you should receive notification within moments.
Finally, save your chart layout by clicking the floppy disk icon and naming it (e.g., “SOL Swing Setup”). This layout now loads instantly whenever you access your account, saving time on repeated setup.
Practical Tips for Better Solana Analysis
- Combine multiple timeframes: Identify the trend on a higher timeframe (daily) before looking for entries on a lower timeframe (4-hour). Trading with the larger trend improves win rates.
- Use TradingView’s multi-chart layout: Open 4-hour, 1-hour, and 15-minute charts simultaneously to confirm entries align across timeframes.
- Track implied volatility: Solana’s option market shows expected price ranges. Higher implied volatility means wider stops may be necessary to avoid being stopped out by normal fluctuations.
- Document your analysis: Use TradingView’s notes feature or keep a separate journal. Recording why you entered a trade and what conditions you observed builds the self-knowledge needed to improve.
- Compare exchange data: Check if price discrepancies exist between Binance, Coinbase, and Kraken. Large spreads may indicate liquidity stress.
- Customize indicator parameters: The settings in this guide work well as starting points, but Solana’s specific volatility profile may respond better to adjusted lengths. Test modifications on historical data before trading live.
- Respect market structure: Don’t fight the trend simply because an indicator shows “overbought.” Strong trends can persist longer than most expect.
Common Mistakes to Avoid
- Setting alerts without context: An alert at $150 means nothing if you haven’t analyzed whether that level represents resistance, a target, or a breakout point.
- Overcomplicating charts with too many indicators: More indicators create conflicting signals. Stick to 2-4 tools you understand deeply rather than adding every available option.
- Ignoring volume: Price moves without volume often reverse. Confirm breakouts and trend changes with accompanying volume spikes.
- Using the wrong timeframe for your strategy: Scalping on daily charts or position trading on 1-minute charts creates misalignment between analysis and execution.
- Neglecting to adjust for Solana’s volatility: The same position size that works for Bitcoin may be too large for Solana given its larger daily ranges.
- Chasing price after a breakout: Wait for a retest of the broken level rather than entering at the initial spike. Retests offer better risk-reward entries.
- Setting stops too tight: Solana’s volatility frequently triggers stops placed at mechanical levels. Allow some room for normal fluctuation.
How do I find Solana on TradingView?
Type “SOL/USDT” in the search bar at the top of the TradingView interface. Select it from the dropdown to load the Solana-to-Tether trading pair. You can also search for “Solana” and choose from available pairs.
Can I trade Solana directly on TradingView?
TradingView is a charting and analysis platform, not a brokerage. You cannot execute trades directly on TradingView. However, you can connect TradingView to partner brokers for execution, depending on your region and the broker’s offerings.
What are the best indicators for Solana trading?
Moving averages (50 and 200 periods) identify trend direction. RSI(14) signals momentum and potential reversal zones. Bollinger Bands capture volatility expansions. Volume profile reveals where trading activity concentrates. No single indicator suffices—combine 2-3 that complement each other.
How do I set a price alert for Solana on TradingView?
Right-click on your chart at the desired price level, select “Add Alert at [price],” and configure notification preferences (browser, email, or mobile push). You can also create alerts through the Alert panel accessible via the clock icon in the toolbar.
Is TradingView good for crypto technical analysis?
TradingView ranks among the best platforms for crypto technical analysis. It offers comprehensive charting, extensive indicator libraries, real-time data from major exchanges, and a social component where traders share ideas. The free tier satisfies most retail traders’ needs.
What timeframes work best for Solana trading?
Day traders commonly use 15-minute and 1-hour charts. Swing traders prefer 4-hour and daily charts. Position traders analyze weekly and monthly timeframes. Choose based on how long you intend to hold positions, and always confirm higher-timeframe trends before executing on lower timeframes.
Conclusion
Mastering Solana analysis on TradingView comes down to three practices: using reliable chart configurations, setting meaningful alerts, and maintaining disciplined market structure analysis. The setup outlined here—50 and 200 SMAs, RSI(14), and Bollinger Bands—provides a foundation you can refine as you develop your trading style.
Start by opening a SOL/USDT chart, adding these indicators, and drawing the most obvious support and resistance levels. Set one price alert at a level you’d actually trade from. Observe how price behaves around these zones over the coming days and weeks. This hands-on experience teaches more than any guide can convey.
Remember that technical analysis offers a framework for making informed decisions, not guarantees. Solana’s volatility creates both opportunity and risk. Protect your capital by sizing positions appropriately, placing stops based on market structure rather than emotion, and accepting that losses occur even with sound analysis. The traders who last in this market manage risk first and seek profit second.
—
This article is for educational purposes only and does not constitute investment advice. Trading and investing carry risk of loss; never invest more than you can afford to lose. Last reviewed: August 2026.