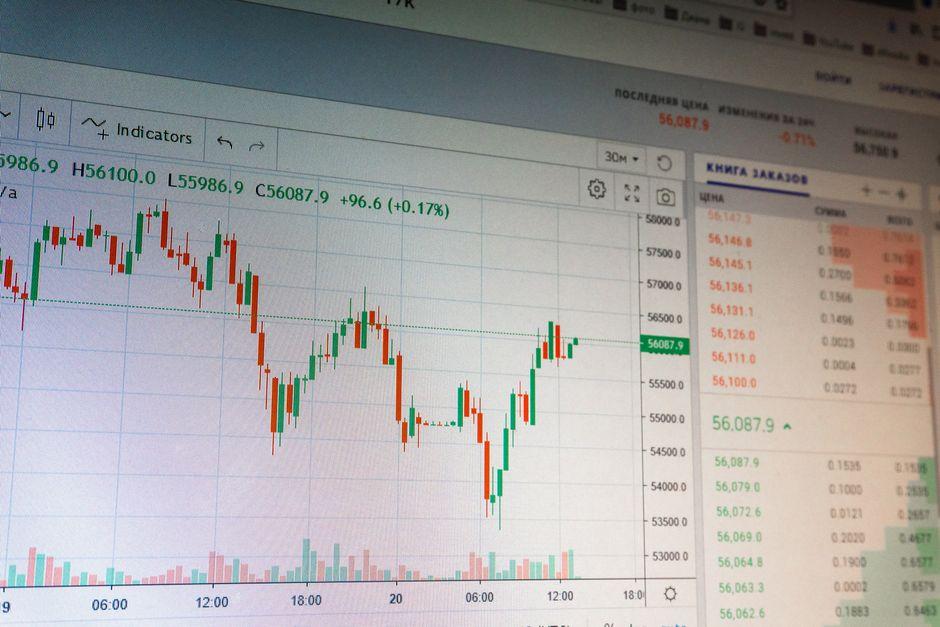
Microsoft Stock Buy or Sell: Valuation and Strategy Guide

Table of Contents
- Introduction
- What Is Microsoft Stock
- Why Microsoft Stock Matters for Traders and Investors
- Core Concepts
- Step-by-Step Guide
- Practical Tips for Better Results
- Common Mistakes to Avoid
- Frequently Asked Questions
- Conclusion
Introduction
Technology equities often face sharp repricing when interest rate expectations shift. During periods where the Federal Reserve signals higher rates for longer, growth stocks like Microsoft frequently experience compressed valuation multiples despite stable fundamentals. Investors watching the ticker often struggle to distinguish between a temporary market overreaction and a genuine deterioration in the business thesis. This uncertainty creates hesitation, leading many to miss accumulation opportunities or buy at peaks driven by sentiment rather than value.
Determining whether to add to a position requires more than reading headlines about artificial intelligence. You need a framework that weighs cloud computing growth against the price you pay for those earnings. This article provides a structured approach to analyzing microsoft stock through the lens of valuation metrics, cash flow durability, and risk management. We will examine the specific mechanics that drive long-term returns and identify where the risks lie for capital preservation.
Market cycles dictate that capital flows toward safety during uncertainty and toward growth during expansion. Understanding where we sit in that cycle helps inform whether a technology giant serves as a defensive hold or an aggressive growth play. The interplay between macroeconomic data and company-specific earnings reports creates volatility that can unsettle even experienced participants. By focusing on measurable data points rather than noise, you can build a conviction level that withstands short-term price fluctuations.
What Is Microsoft Stock
Microsoft stock represents equity ownership in Microsoft Corporation, a multinational technology company listed on the Nasdaq under the ticker MSFT. Buying a share means you own a fractional claim on the company’s assets and future cash flows, subject to the rights of common shareholders. The stock is a component of major indices like the S&P 500 and the Nasdaq 100, meaning its performance influences broader market funds and ETFs.
For example, an investor purchasing 100 shares gains exposure to the company’s diverse revenue streams, including productivity software, cloud infrastructure, and gaming. Unlike a bond, there is no maturity date or guaranteed coupon. Your return depends on capital appreciation and any dividends declared by the board of directors. The security trades during standard market hours, with liquidity typically allowing for tight bid-ask spreads during the session.
Equity holders stand behind debt holders in the capital structure during liquidation events, which introduces a higher degree of risk compared to fixed income securities. Yet, this risk premium offers the potential for unlimited upside if the business continues to expand its market share and profitability. Shareholders also possess voting rights on key corporate governance issues, such as board elections and executive compensation packages. These rights allow investors to have a say in the strategic direction of the enterprise, although individual retail influence remains minimal compared to institutional holders.
The liquidity profile of this equity allows for significant position sizes without moving the market price excessively. High average daily volume ensures that entry and exit orders can be filled efficiently. This characteristic is crucial for active traders who need to manage risk exposure dynamically. For long-term holders, the liquidity provides peace of mind knowing that the asset can be converted to cash quickly if personal financial circumstances change.
Why Microsoft Stock Matters for Traders and Investors
Institutional portfolios often hold this equity as a core technology allocation due to its balance sheet strength and recurring revenue model. For active traders, the stock offers sufficient daily volume to enter and exit positions without significant slippage. Long-term investors value the dividend growth history, which provides a cushion during flat price periods. Ignoring the specific drivers of this company can lead to misallocation of capital within a tech-heavy portfolio.
If you overlook the valuation entry point, you risk enduring years of flat returns while earnings catch up to the price. Conversely, avoiding the stock entirely during periods of undue pessimism might mean missing out on compounding from cloud expansion. Understanding the mechanics helps you decide whether the current price offers a margin of safety. It also informs position sizing, ensuring that a single equity does not dominate your portfolio risk profile.
The company acts as a bellwether for the broader technology sector. When earnings reports miss expectations, the ripple effect often impacts competitors and suppliers alike. This correlation means that holding this stock provides exposure to the health of the entire digital economy. Portfolio managers watch the stock closely to gauge sentiment regarding enterprise software spending and cloud infrastructure demand.
Risk management becomes easier when you understand the factors that move the price. Volatility often spikes around earnings releases or macroeconomic data prints. Knowing these catalysts allows you to adjust hedge ratios or reduce exposure ahead of known events. A disciplined approach prevents emotional decision-making during periods of market stress. Capital preservation relies on recognizing when the risk-reward ratio shifts unfavorably.
Forward P/E Valuation Multiples
The forward price-to-earnings ratio compares the current share price to estimated earnings per share over the next twelve months. This metric helps gauge how much investors are willing to pay for a dollar of future profit. A higher multiple suggests the market expects faster growth, while a lower multiple may indicate skepticism or slower expansion. You must compare the current ratio against the company’s five-year historical median to understand if the stock is expensive relative to its own history.
Consider a scenario where the forward P/E expands significantly above the historical average without a corresponding acceleration in earnings growth. This divergence often precedes a period of multiple compression, where the price falls even if earnings remain stable. For example, if the multiple reaches 35x while the five-year average sits at 28x, the stock prices in perfection. Any miss in quarterly guidance could trigger a sharp reversion to the mean. Evaluating this multiple helps you avoid buying when expectations are too high to sustain.
Analyst estimates form the denominator of this ratio, and these numbers change frequently. Revisions upward can lower the ratio even if the price stays flat, making the stock appear cheaper. Revisions downward have the opposite effect, potentially triggering sell-offs. Monitoring the trend of estimate revisions provides insight into sentiment among professional analysts. A cluster of downgrades often signals trouble before it appears in the official financial statements.
Azure Segment Revenue Growth Rate
Cloud computing revenue serves as the primary engine for top-line expansion. The Azure segment growth rate indicates how quickly the infrastructure business is capturing market share from competitors. Investors watch this figure closely because cloud contracts are typically long-term, providing visibility into future cash flows. A deceleration in this rate often signals increased competition or saturation in key markets, which can weigh on the stock price.
Suppose the reported growth rate for the cloud segment slows from 30 percent to 20 percent year-over-year. This deceleration might not mean the business is shrinking, but the rate of expansion is moderating. In practice, the market often penalizes this slowdown disproportionately, causing the stock to underperform the Nasdaq 100. You should analyze whether the slowdown is due to macroeconomic spending cuts or structural competitive losses. Understanding this distinction allows you to determine if the weakness offers a buying opportunity or signals a deeper issue.
Cloud infrastructure requires massive capital expenditure to build data centers and purchase hardware. Investors need to watch whether revenue growth outpaces these capital costs. If spending rises faster than revenue, margins could compress, affecting overall profitability. Management commentary on capacity constraints and demand visibility provides context for the raw growth numbers. Strong demand with limited supply suggests pricing power, while weak demand suggests potential discounting to win contracts.
Free Cash Flow Yield Calculation
Free cash flow yield measures the cash generated by the business relative to its market capitalization. You calculate this by dividing free cash flow per share by the current share price. This metric acts as an inverse P/E ratio, showing the cash return you receive on your investment before any dividend. A higher yield suggests the company generates substantial cash compared to its price, which can support dividends, buybacks, or reinvestment.
Imagine a situation where the stock price declines by 15 percent while free cash flow remains stable. The yield naturally increases, making the equity more attractive on a cash basis. For example, if the yield moves from 3 percent to 4 percent, it may attract income-focused investors who view the cash generation as a bond-like proxy. This dynamic can create a floor for the stock price during broader market sell-offs. Monitoring this yield helps you identify moments when the market undervalues the cash-generating ability of the enterprise.
Capital expenditures impact free cash flow significantly. Heavy investment cycles, such as building AI infrastructure, can temporarily depress cash flow even if the business is healthy. You must distinguish between maintenance capex required to keep the lights on and growth capex designed to expand future revenue. Growth capex should lead to higher cash flows in subsequent years. Analyzing the trend over several quarters smooths out the noise from lumpy capital spending patterns.
Step 1 — Assess Valuation vs History
Begin by pulling the current forward P/E ratio and comparing it to the five-year historical range. You can find this data in SEC filings or through financial data terminals. If the current multiple sits at the upper end of the range, exercise caution regarding new capital deployment. Wait for a pullback that brings the multiple closer to the median before establishing a large position. This discipline prevents you from chasing performance when risk-reward ratios are skewed.
Historical ranges provide context but do not guarantee future performance. Structural changes in the business, such as a shift to higher-margin cloud revenue, might justify a permanently higher multiple. You need to assess whether the business model has evolved enough to warrant a re-rating. Comparing the valuation against peers helps validate whether the premium is justified. If competitors trade at lower multiples with similar growth rates, the stock might be overvalued.
Step 2 — Analyze Segment Growth (Azure)
Review the latest earnings report to isolate the growth rate of the intelligent cloud segment. Look for commentary on consumption trends and remaining performance obligations. If growth remains strong despite macroeconomic headwinds, the fundamental thesis remains intact. But if management guides for lower cloud consumption, adjust your expectations for future earnings. Use this information to decide whether to hold, add, or reduce exposure based on your growth requirements.
Remaining performance obligations represent contracted revenue not yet recognized. This backlog provides visibility into future quarters. A growing backlog suggests strong sales momentum, while a shrinking backlog might indicate slowing demand. Management discussion on large enterprise deals versus small business consumption offers nuance. Enterprise contracts provide stability, while consumption-based models offer flexibility but vary with economic conditions.
Step 3 — Determine Position Size
Calculate the appropriate weight for the stock within your total portfolio based on volatility and correlation. A common rule is to limit single-stock exposure to avoid idiosyncratic risk. For example, if your portfolio totals 100,000 dollars, you might cap this position at 5 percent to manage drawdown risk. Use limit orders to enter the position gradually rather than executing a market order all at once. This approach averages your entry price and reduces the impact of intraday volatility.
Correlation with the broader market affects how much risk a single position adds. If the stock moves in lockstep with your other holdings, you effectively have less diversification than you think. Adjusting size based on beta ensures that a market-wide downturn does not wipe out a disproportionate amount of capital. Risk models often suggest smaller positions for high-volatility assets. Sticking to these limits protects the portfolio from catastrophic loss events.
Practical Tips for Better Results
- Accumulate shares during broader tech sector corrections when implied volatility spikes, as this often lowers your average cost basis.
- Sell covered calls against a 100-share position post-earnings beat to generate income while waiting for the next entry point.
- Monitor the 10-year Treasury yield, as rising rates often compress valuation multiples for large-cap technology stocks.
- Reinvest dividends automatically to compound returns, especially during periods where price appreciation is limited.
- Check the correlation with the Nasdaq 100 to ensure you are not inadvertently doubling down on beta risk.
- Set stop-loss levels based on technical support zones rather than arbitrary percentage declines to protect capital.
- Review quarterly 10-Q filings for changes in share count to understand the impact of buybacks on earnings per share.
Options strategies like covered calls generate premium income but cap upside potential. You must decide if the income is worth limiting gains during a strong rally. Implied volatility expands during uncertainty, making option premiums more expensive. Selling during these periods yields higher income but carries higher assignment risk. Understanding the Greeks helps manage these positions effectively.
Treasury yields act as the risk-free rate in valuation models. When yields rise, the present value of future cash flows falls. This mathematical relationship puts pressure on long-duration assets like technology stocks. Watching the bond market provides an early warning signal for equity valuation pressure. A sharp move in yields often precedes a rotation out of growth stocks.
Common Mistakes to Avoid
- Chasing the stock after a massive earnings gap-up often leads to buying at short-term tops where profit-taking is likely.
- Ignoring valuation multiples can result in holding expensive assets that underperform during rate hike cycles.
- Overconcentrating your portfolio in one technology name exposes you to unnecessary regulatory or operational risk.
- Panic selling during macro-driven drawdowns locks in losses before the fundamental thesis has actually changed.
- Neglecting dividend reinvestment reduces the compounding effect over long holding periods.
- Failing to adjust position size during high volatility regimes can lead to outsized drawdowns that breach risk limits.
Emotional trading frequently leads to buying high and selling low. Fear of missing out drives investors to enter positions after significant rallies. Patience allows you to wait for better entry prices. Discipline ensures you stick to the plan even when market sentiment turns negative. Writing down your investment thesis helps you stay objective during volatile periods.
Regulatory scrutiny remains a constant risk for large technology firms. Antitrust investigations can limit growth opportunities or force structural changes. Ignoring these headline risks can lead to sudden valuation adjustments. Diversification across sectors mitigates the impact of company-specific regulatory events. Staying informed on policy developments helps anticipate potential headwinds.
how to buy microsoft stock?
You can purchase shares through a brokerage account by searching for the ticker MSFT and placing a buy order. Most platforms allow market orders for immediate execution or limit orders to specify a price. Ensure your account is funded and verified before attempting to trade.
Different account types offer varying tax treatments. Retirement accounts defer taxes on gains, while taxable accounts incur liabilities upon selling. Understanding the tax implications helps you optimize after-tax returns. Some brokers offer fractional shares, allowing you to invest specific dollar amounts rather than whole shares. This feature facilitates precise position sizing for smaller accounts.
what is the price target for microsoft stock?
Analyst price targets vary based on different valuation models and assumptions about future growth. These targets are estimates, not guarantees, and often change following earnings releases. You should form your own thesis based on fundamentals rather than relying solely on external targets.
Consensus targets represent an average of many opinions, which may lag behind real-time data. Individual analysts might have conflicting views based on their models. Using targets as a reference point rather than a directive allows you to maintain independence. Your own research into cash flows and growth rates provides a more reliable foundation for decision-making.
why is microsoft stock down today?
Daily price movements often reflect broader market sentiment, macroeconomic data, or sector rotation rather than company-specific news. Rates, liquidity, and positioning move prices in the short run; earnings and cash flows move them over years. Check news feeds for specific announcements if the move deviates from the broader index.
Algorithmic trading contributes to short-term volatility. Large institutional orders can trigger cascading stops that exaggerate price moves. These fluctuations rarely reflect changes in intrinsic value. Focusing on long-term fundamentals helps you ignore noise that distracts from the investment thesis. Patience is required to let the business value accrue over time.
when is the best time to buy microsoft stock?
Historically, accumulating during periods of market stress or valuation compression offers better long-term returns. There is no perfect timing mechanism, so dollar-cost averaging can mitigate entry risk. Focus on valuation metrics rather than trying to time the exact bottom of a drawdown.
Trying to catch the exact bottom often results in missing the recovery entirely. Systematic buying removes emotion from the equation. Spreading purchases over time ensures you capture a range of prices. This strategy reduces the risk of deploying all capital at a peak. Consistency matters more than precision in long-term wealth building.
can i buy microsoft stock without a broker?
You generally need a brokerage account to access public exchanges where the stock trades. Some platforms offer direct stock purchase plans, but these are less common for large-cap tech firms. A standard brokerage account provides the most liquidity and control over order types.
Direct purchase plans often have limitations on trading frequency and order types. Brokerage accounts offer advanced tools for analysis and execution. Fees vary between platforms, so comparing cost structures is wise. Some brokers offer commission-free trading, which benefits frequent investors. Ensure the platform is regulated and offers security protections for your assets.
is microsoft stock a good long term investment?
The company has a strong balance sheet and diversified revenue streams that support long-term holding. But past performance does not guarantee future results, and valuation matters at the time of entry. Assess your own risk tolerance and time horizon before committing capital for the long term.
Technological shifts can disrupt even dominant players. Continuous innovation is required to maintain competitive advantages. Monitoring research and development spending indicates commitment to future growth. A static business model risks obsolescence over decades. Long-term investing requires ongoing review of the competitive position.
Conclusion
Deciding whether to add Microsoft stock to your portfolio depends on aligning the current valuation with your return expectations. The framework outlined above prioritizes cash flow yield and segment growth over short-term price action. By waiting for favorable multiples and managing position size, you protect capital while maintaining exposure to quality assets.
Your next step should involve reviewing the latest quarterly filing to update your growth assumptions. Compare the current free cash flow yield against the 10-year Treasury rate to assess relative value. Remember that all equity investments carry the risk of loss, and no strategy guarantees profits. Trade with a plan that accounts for volatility and preserves your ability to stay in the market over full cycles.
Success in investing comes from discipline and continuous learning. Markets evolve, and strategies must adapt to new conditions. Keeping a journal of your trades helps identify patterns in your decision-making. Reviewing both wins and losses provides valuable feedback for improvement. Building wealth is a marathon that requires patience and resilience.
—
This article is for educational purposes only and does not constitute investment advice. Trading and investing carry risk of loss; never invest more than you can afford to lose.
Last reviewed: August 2026